


In modern cloud-native architectures, Kubernetes has become the most popular container orchestration platform. To ensure the health and performance of containerized applications, monitoring is essential in Kubernetes environments. Among the Kubernetes monitoring ecosystem, PodMonitor and ServiceMonitor, two powerful monitoring tools provided by the Prometheus Operator, have become key components of observability systems. They help efficiently monitor cluster resources. This article introduces the concepts, configurations, and use cases of PodMonitor and ServiceMonitor, helping you better understand how to use them to enhance Kubernetes monitoring capabilities.
What are PodMonitor and ServiceMonitor?
In Kubernetes environments, PodMonitor and ServiceMonitor are both Custom Resource Definitions (CRDs) provided by the Prometheus Operator. These resources allow Prometheus to flexibly collect monitoring data at the Pod and Service levels.
1. PodMonitor
(1) Overview
PodMonitor is a resource designed to monitor individual Pods or groups of Pods in Kubernetes. It allows users to select Pods using label selectors and define metrics endpoints for scraping.
PodMonitor is highly flexible and is particularly suitable for dynamic or short-lived workloads, such as Jobs or DaemonSets.
(2) Configuration
To create a PodMonitor resource, the following key elements are required:
Label selector:
selector, used to match Pod labelsMetrics endpoint:
podMetricsEndpoints, specifying the port and path of metricsAutomatic discovery: When matching Pods are created or deleted, PodMonitor dynamically updates targets without manual intervention
(3) Use cases
Independent Pod monitoring: Ideal when Pods do not expose metrics through a Service
Dynamic Pod monitoring: Suitable for short-lived Pods with frequent lifecycle changes
2. ServiceMonitor
(1) Overview
ServiceMonitor is another CRD used to monitor Kubernetes Services. It selects Services using label selectors and monitors the Endpoints behind them.
ServiceMonitor is better suited for stable and well-defined service-based monitoring scenarios.
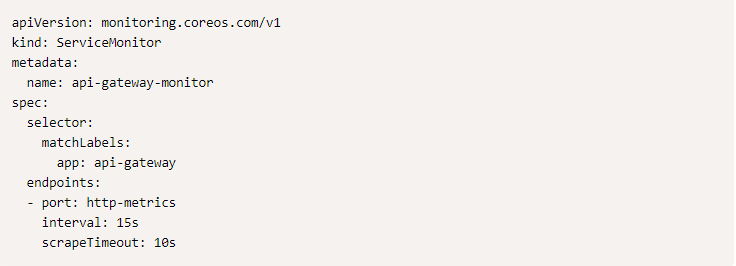
(2) Configuration
To create a ServiceMonitor resource, the following key elements are required:
Service discovery:
selector, used to match Service labelsEndpoint configuration:
endpoints, defining metrics port and pathUnified configuration: Allows defining global scraping rules such as interval and authentication
(3) Use case
Service-level monitoring: Best used when metrics are exposed through a stable Service abstraction
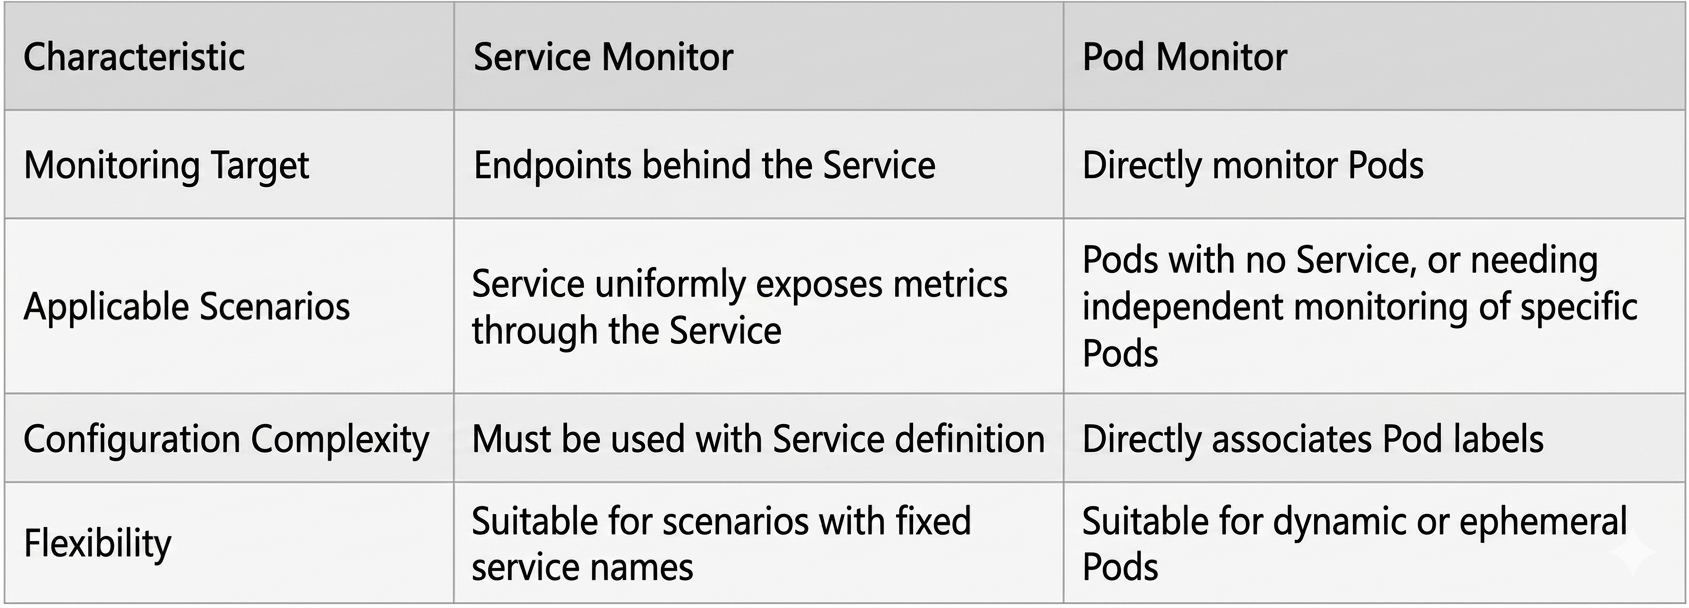
3. Comparison and Selection
Bonree ONE Integrated Observability Platform: PodMonitor & ServiceMonitor Practice
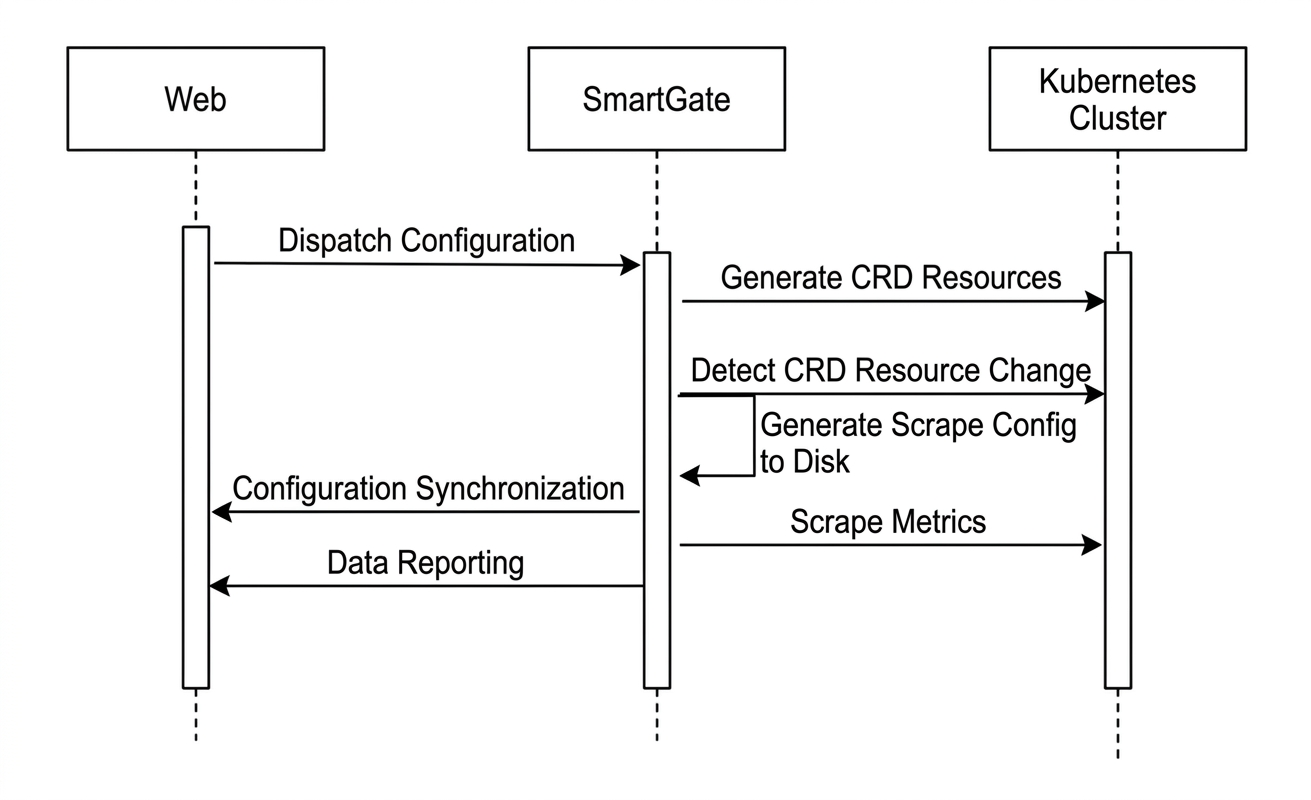
(Interaction flow between PodMonitor and ServiceMonitor)
Web interface sends PodMonitor/ServiceMonitor configurations to SmartGate
SmartGate applies the configuration and generates PodMonitor/ServiceMonitor objects
SmartGate calls the Kubernetes API to query these resources and syncs updates back to the web backend
SmartGate matches Pods/Services based on namespace, labels, and annotations defined in PodMonitor/ServiceMonitor, then generates Prometheus scrape configurations and writes them into SmartGate
SmartGate scrapes metrics from matched Pods/Services and reports them to the web backend
Conclusion
PodMonitor and ServiceMonitor are two powerful monitoring tools provided by the Prometheus Operator, playing a critical role in Kubernetes cluster observability. PodMonitor is more suitable for dynamic or short-lived Pods, while ServiceMonitor is better for stable service-based monitoring. By choosing and configuring them appropriately, we can efficiently monitor various resources in Kubernetes clusters and ensure system stability.
As cloud-native architectures continue to evolve, Kubernetes monitoring will become increasingly important. Mastering PodMonitor and ServiceMonitor will give you a strong advantage in the field of Kubernetes observability.