


In production environments, the most troublesome issues are often not obvious errors, but “slow-running yet successful” SQL queries. They execute without failure, but under high-frequency calls or growing data volumes, they quietly become performance bottlenecks across entire service chains.
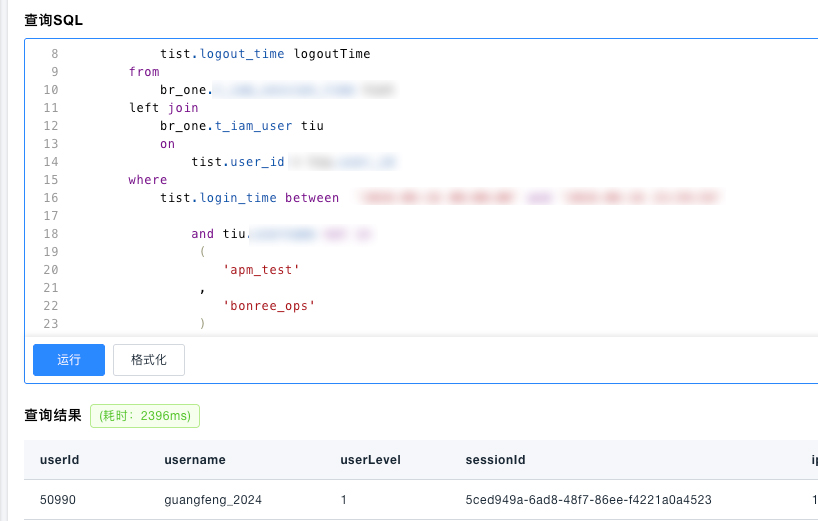
Here is a real slow query: a multi-table aggregation SQL with a LEFT JOIN. A single execution takes 0.605 seconds. It may seem acceptable at first glance, but under repeated invocation scenarios, it already becomes a clear performance issue. In the past, diagnosing such problems required engineers to manually inspect execution plans and infer causes line by line—time-consuming and heavily dependent on individual experience. This time, we handed it over to Bonree ONE’s Sage AI.
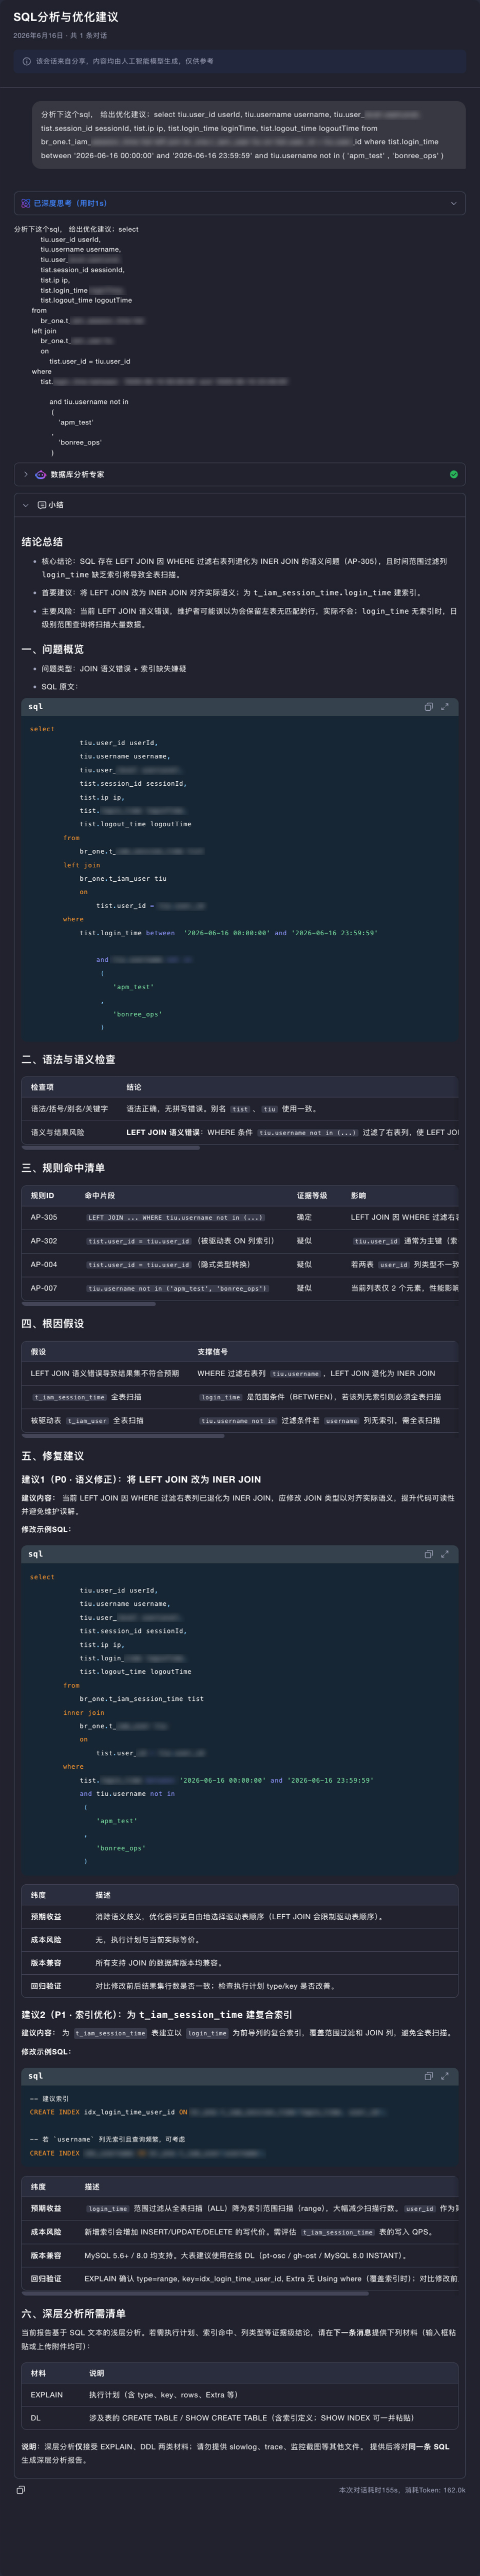
Sage AI does not simply output a generic suggestion like “add an index.” Instead, it provides a structured analysis process.
In the first step, it performs syntax and semantic analysis. It detects that the WHERE clause applies a NOT IN filter on the right table field tiu.username. This is critical: it indicates that the original LEFT JOIN has effectively degenerated into an INNER JOIN, making the overhead of preserving null-extended rows in the LEFT JOIN unnecessary.
In the second step, it applies a rule-based diagnostic checklist. Sage AI matches the query against built-in optimization rules and annotates evidence levels. Among them, AP-305 precisely flags the JOIN semantic issue mentioned above, while AP-302 identifies missing indexes on the columns involved in the JOIN operation.
In the third step, it generates root-cause hypotheses based on the accumulated evidence.
In the fourth step, it outputs two actionable optimization recommendations:
P0 level: Rewrite the LEFT JOIN as an INNER JOIN to remove semantic ambiguity and unnecessary overhead.
P1 level: Create a composite index on the
login_timeanduser_idcolumns of thet_iam_session_timetable to prevent full table scans.
Each recommendation includes expected performance gains, implementation cost, and regression risk—making it clear whether and how safely the change can be applied.
Want deeper analysis? Add execution plans and DDL.
The above analysis is primarily based on rules and metrics. To further validate the root cause, you can also provide Sage AI with two additional inputs: the SQL execution plan (EXPLAIN) and the table schema (DDL).
With the execution plan, Sage AI can understand the actual query execution path—whether it is performing a full table scan (type=ALL), using indexes, estimating scanned rows, or generating temporary tables and filesorts.
With the DDL, it can verify field types, existing indexes, and data scale, and assess whether a proposed composite index is truly effective based on column order and selectivity.
By combining these two inputs, the analysis evolves from rule-based inference to evidence-based validation of real execution behavior, making optimization recommendations more precise and reliable.
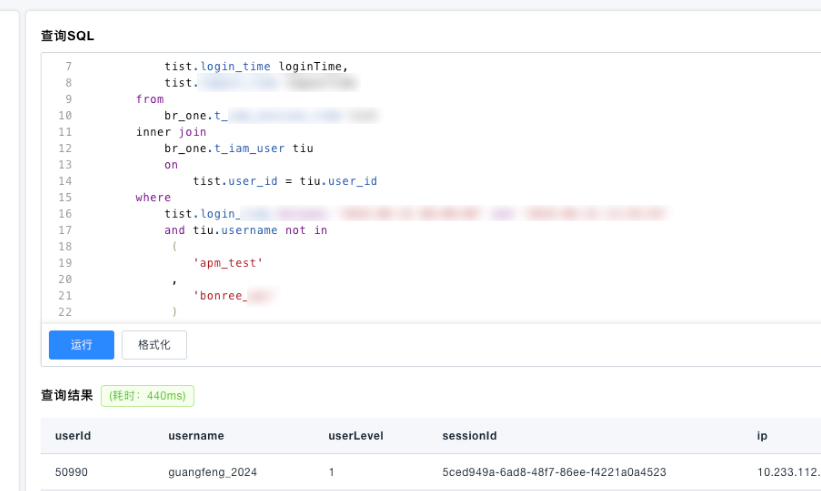
Finally, we implemented the suggested changes: we rewrote the JOIN logic, added the appropriate index, and further optimized the query by pre-aggregating derived tables before joining to reduce intermediate result size.
After the changes, the query execution time dropped from 0.605 seconds to 0.01 seconds—an improvement of approximately 60×.
Looking back at the entire process, no one had to manually inspect execution plans or guess the root cause line by line. Sage AI clearly explained what was wrong, where to fix it, and what risks were involved. Engineers only needed to make decisions and validate results.
For teams handling hundreds or thousands of SQL queries daily, this means turning optimization expertise—once dependent on a few specialists and hard to scale—into a capability available on demand within the platform, enabling every engineer to read and fix abnormal SQL like a seasoned DBA.