




Bonree ONE AI Observability delivers end-to-end visibility into LLM and AI agent applications, connecting execution traces, performance metrics, token consumption and session insights to help teams understand, troubleshoot and optimize AI application performance in production.
Imagine a user asking an AI assistant, "When will my order arrive?" After waiting more than ten seconds, the assistant replies, "It is expected to arrive tomorrow." But the actual order status in the underlying system does not support that answer.
For the user, it is a slow and inaccurate experience. For development and operations teams, it raises a series of questions: Was the time spent on model inference, knowledge retrieval or tool execution? Did the incorrect response come from the model itself, or did a downstream service return outdated data? How many tokens did the request consume?
Traditional application monitoring can tell teams whether a service is reporting errors or an API is responding slowly. But it cannot easily explain what happened during an AI interaction. A single response may involve agent orchestration, model calls, retrieval, tool execution and multiple retries.
To operate AI applications effectively, teams need to connect user experience, internal execution and resource consumption along the same observable path.
Trace Every Step Behind an AI Response
Troubleshooting should start with the actual user request, rather than assumptions about what might have gone wrong.
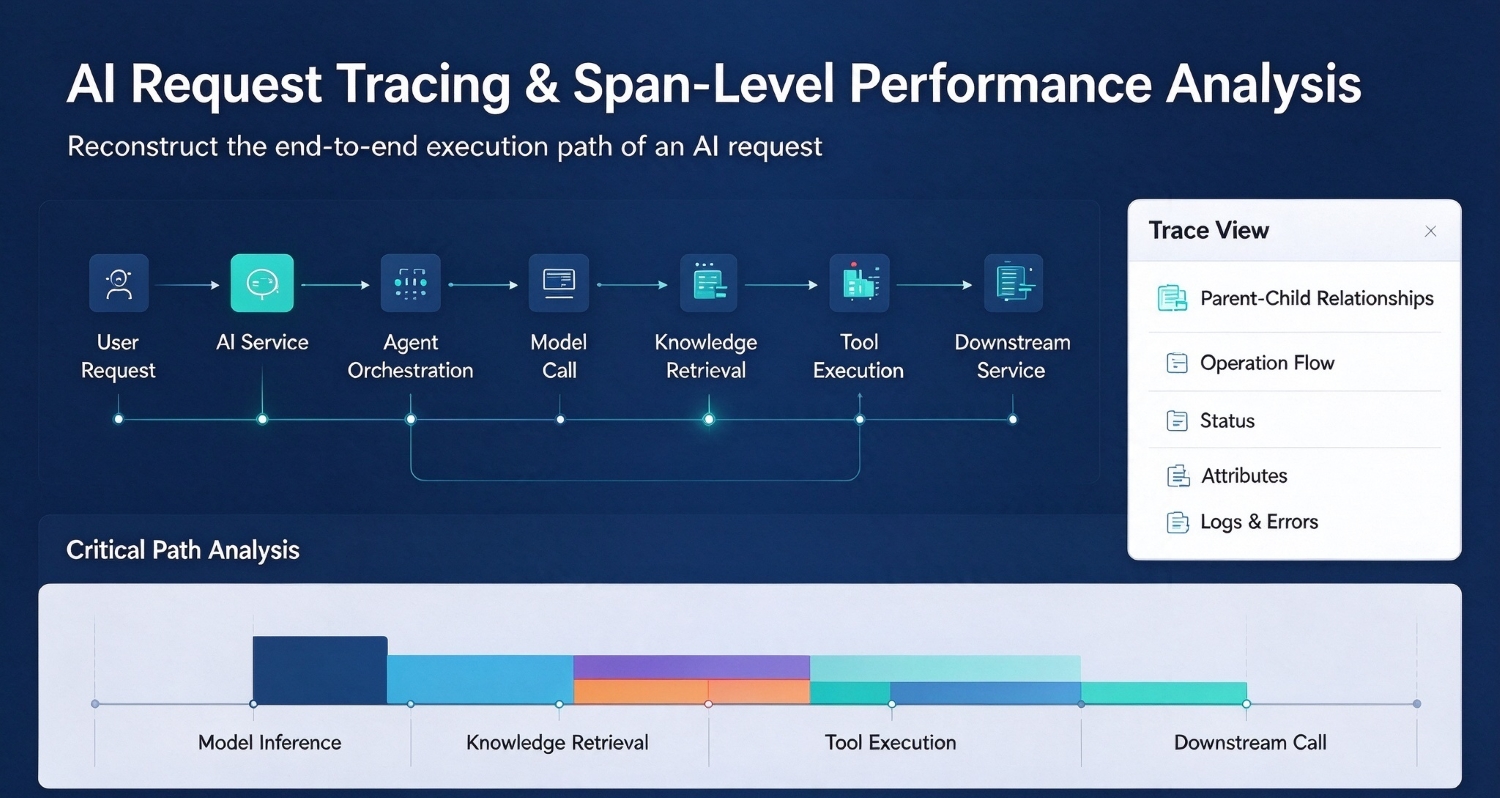
Bonree ONE AI Observability uses distributed tracing to reconstruct the execution path of an AI request. Teams can trace how a conversation enters an AI service, which models an agent invokes, which tools it calls and which downstream services it accesses. Each operation can be examined through its corresponding Span within the Trace.
By opening an individual Span, engineers can inspect its parent-child relationships, start and end times, execution duration, status, attributes and error details. Stack traces and associated logs provide further context for investigation.
This makes it possible to move beyond a general observation such as "the AI response is slow" and narrow the issue down to a specific operation: which step introduced the delay, when the slowdown began, and whether errors or retries occurred.
For inaccurate AI responses, the same execution path provides useful evidence. Teams can investigate whether the model used outdated context, whether a tool call failed or whether a downstream API returned unexpected data. Traces show how the request was executed, while logs and error details help validate what happened.
For requests involving parallel operations, teams should also examine the end-to-end critical path. The overall response time cannot be determined simply by adding the duration of every Span.
Performance Analysis: Look Beyond Average Response Time
AI application performance cannot be understood through average response time alone.
Some requests may complete quickly, while others experience long delays caused by retrieval, model inference or tool execution. These long-tail requests can have a significant impact on the user experience, even when average response time appears normal.
Bonree ONE correlates service-level metrics, including request volume, error rates and response times, with distributed traces. Teams can first identify the time window in which an anomaly occurred, then drill down into specific slow requests and compare the time spent across model calls, tool executions and downstream requests.
This correlation helps distinguish different types of performance issues.
For example, if response latency increases alongside error rates and retry counts, the problem may involve repeated execution rather than a single slow operation. Retries can also generate additional token consumption. Conversely, slower model inference does not necessarily mean that the entire execution path requires optimization.
By attributing latency to individual Spans, development and operations teams can determine where to focus their efforts: refining prompts, adjusting model selection and parameters, improving tool APIs or investigating runtime resources.
Token Usage and Cost: Understand Where Resources Are Spent
AI application costs are influenced by request volume, input and output length, and model selection. Looking at total token consumption can reveal increasing usage, but it does not necessarily explain what is driving that increase.
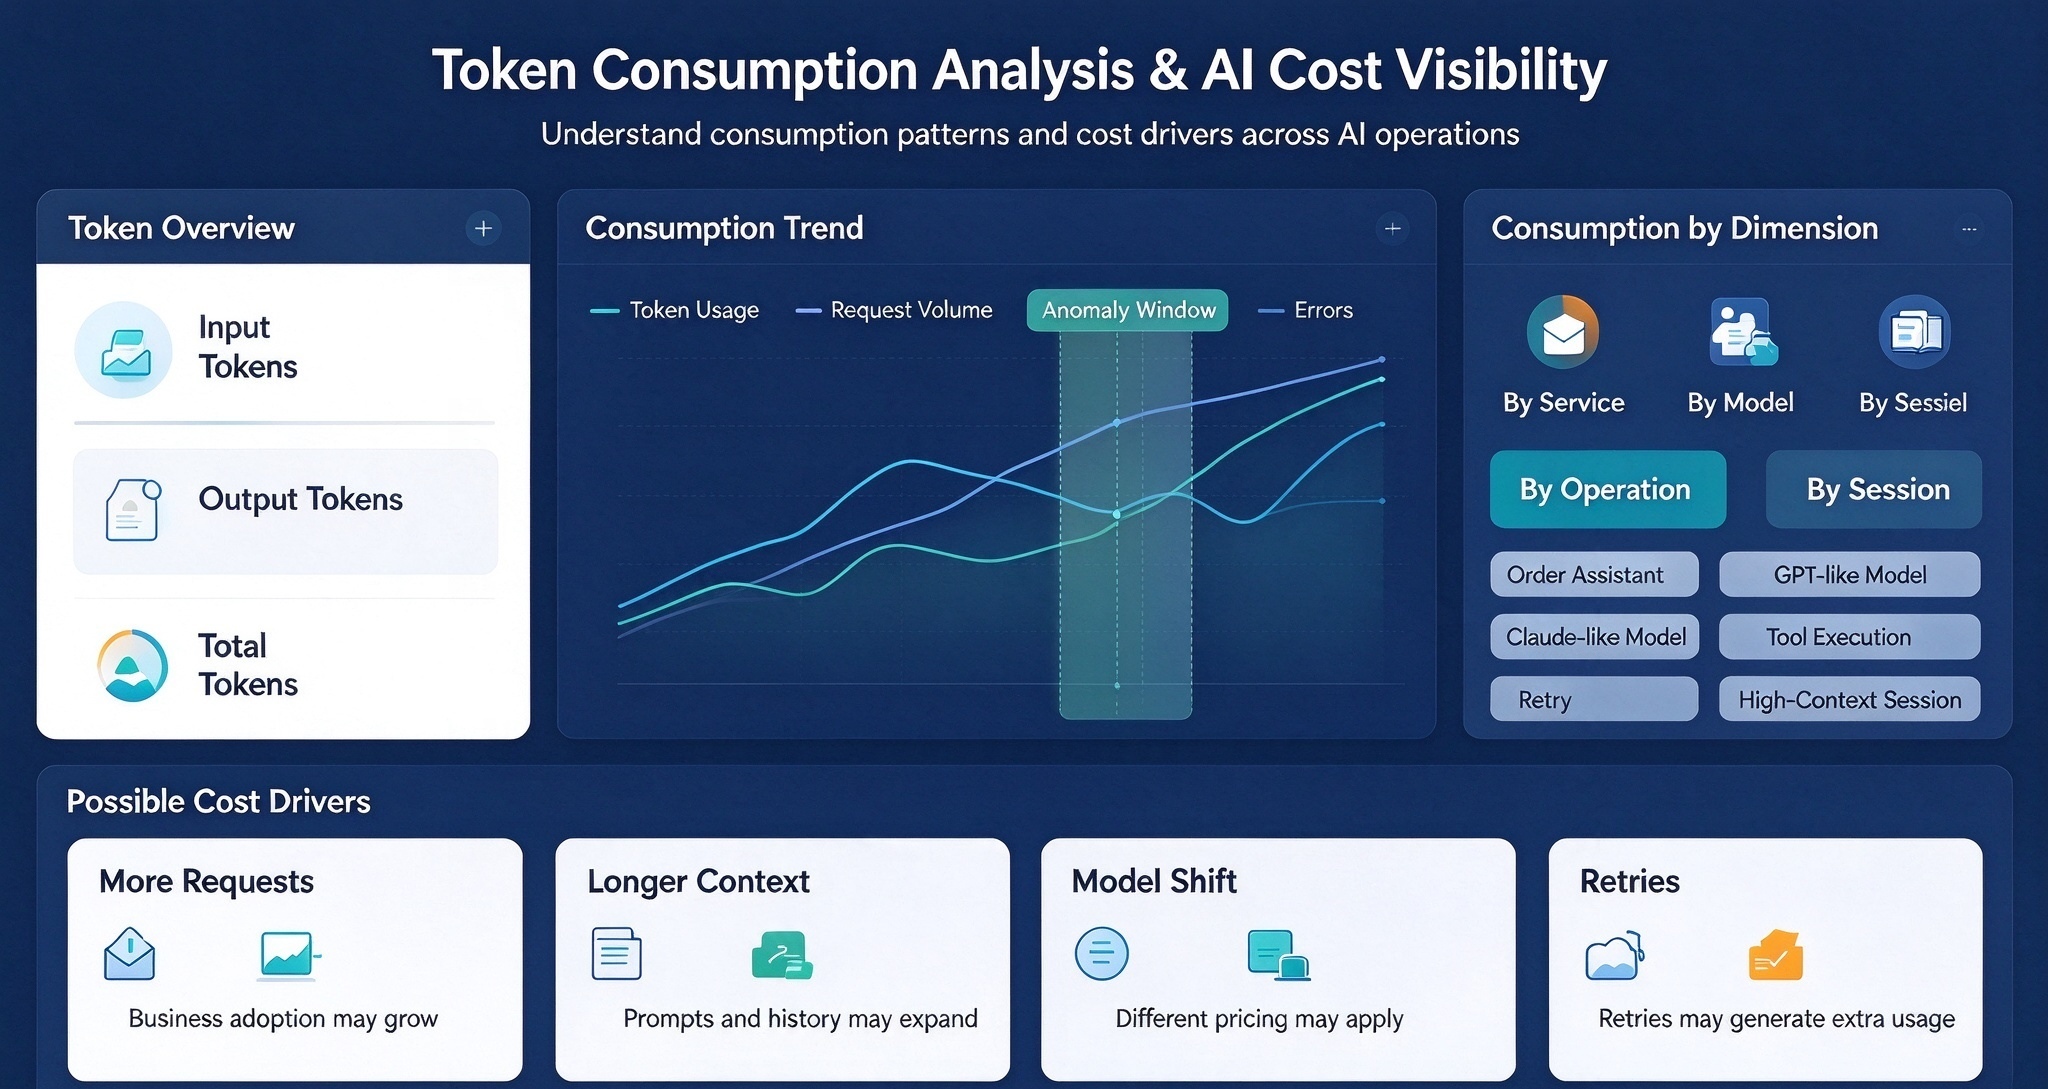
Bonree ONE AI Observability tracks input tokens, output tokens and total token consumption, allowing teams to examine usage by service, model and time period. This provides a basis for understanding consumption patterns, estimating costs and identifying optimization opportunities.
Token usage may increase for several reasons:
● Increased request volume: A new business scenario brings more legitimate AI interactions.
● Longer prompts and context: Expanded instructions or conversation history increase input token consumption.
● Model selection: Certain tasks begin using models with different pricing structures.
● Repeated execution: Failed requests and retries trigger additional model calls and token consumption.
These scenarios have different implications. Increased usage may reflect growing business adoption, while longer prompts, inefficient model selection or repeated execution may indicate opportunities to improve efficiency.
By correlating token trends with request volume, error rates, sessions and model distribution, teams can better understand the underlying reasons for cost changes.
Cost optimization, however, should not simply mean reducing token usage. Tasks that require extensive context or complex reasoning may need more input to maintain response quality. A more effective approach is to identify high-consumption services, models and sessions, then evaluate optimization strategies in the context of user experience and application requirements.
One Platform, Different Perspectives on AI Operations
Different teams need different levels of visibility into AI application operations.
For management teams, the priority is understanding how AI applications and agents are being used, where consumption is increasing and whether operations remain stable. Aggregating invocation counts, activity trends, token consumption and estimated costs by agent helps connect resource usage with business adoption. Teams can then drill down into models and sessions to understand the changes behind the overall numbers.
For development and operations teams, troubleshooting requires more granular evidence. They can move from an abnormal time window to an individual Trace, inspect Span duration, errors and stack traces, and follow upstream and downstream dependencies to understand the impact.
Correlating traces with logs, events and alerts helps validate potential root causes. The runtime environment should also be considered. CPU, memory and disk utilization on the containers or hosts running AI services may be related to response-time fluctuations. Compute-specific metrics can provide additional insight when the relevant integrations are configured.
Session analysis adds another important perspective. By examining conversations across sessions, teams can identify recurring failures, investigate problematic interactions and determine whether issues are concentrated around particular models, tools or task types. This helps teams move beyond individual incidents and identify patterns that require continuous improvement.
Turn Troubleshooting into a Verifiable Improvement Loop
When an AI application encounters an issue, teams need a consistent process to move from detection to resolution and verify whether the problem has actually been addressed.
A practical troubleshooting workflow can follow four steps:
1. Identify the issue. Start with user feedback, abnormal error rates, increased response times or session quality issues to determine the affected time window.
2. Trace the execution. Open the relevant Trace and identify the operations associated with the highest latency or errors.
3. Validate the root cause. Examine Span details and correlate traces with logs, events, alerts and runtime resource metrics to verify what happened.
4. Verify the improvement. After making changes, review user experience, performance metrics and token consumption trends to determine whether the issue has been resolved.
The value of this process goes beyond faster troubleshooting. It gives different teams a shared understanding of the same issue. Business teams can understand the impact on users, engineers can identify the specific failing operation, and management can explain changes in usage and resource consumption.
Instead of relying on disconnected dashboards and isolated metrics, teams can work from a connected chain of evidence built around each AI request.
Make AI Applications Observable in Production
As AI applications evolve from simple model interactions to complex agent-driven workflows, understanding their behavior requires more than monitoring model availability or API response times.
Teams need to answer several fundamental questions: What did the user experience? What actually happened during execution? Where were time and resources spent? Which users or services were affected, and where should troubleshooting begin?
Bonree ONE organizes AI services and their upstream and downstream relationships through its entity and metric models, connecting distributed traces, performance metrics, token consumption, session insights and operational evidence.
By bringing these signals together with application and infrastructure monitoring, Bonree ONE AI Observability helps teams understand the actual operating state of LLM and AI agent applications, investigate performance issues, analyze resource consumption and identify actionable paths for optimization.
Making every AI response traceable and every resource consumption pattern understandable is an important step toward improving user experience, managing application costs and ensuring reliable AI operations in production.
FAQ
1. How is AI Observability different from traditional application monitoring?
Traditional monitoring focuses on service availability, infrastructure health and API performance. AI Observability extends this visibility to LLM calls, agent workflows, retrieval operations, tool executions and token consumption.
2. Why is distributed tracing important for AI applications?
AI requests often involve multiple model calls, agent operations, retrieval steps and tool executions. Distributed tracing connects these operations into an end-to-end execution path, helping teams identify latency bottlenecks, failed operations and potential root causes.
3. How can teams monitor token usage and AI costs?
By tracking input tokens, output tokens and total token consumption across services and models, teams can understand usage patterns. Correlating token consumption with request volume, error rates and sessions helps identify the factors driving cost increases.
4. How does Bonree ONE support AI Observability?
Bonree ONE AI Observability provides distributed tracing, performance monitoring, token consumption analysis and session insights for LLM and AI agent applications. Combined with application and infrastructure monitoring, it helps teams investigate execution issues and understand resource consumption in production.