


Background
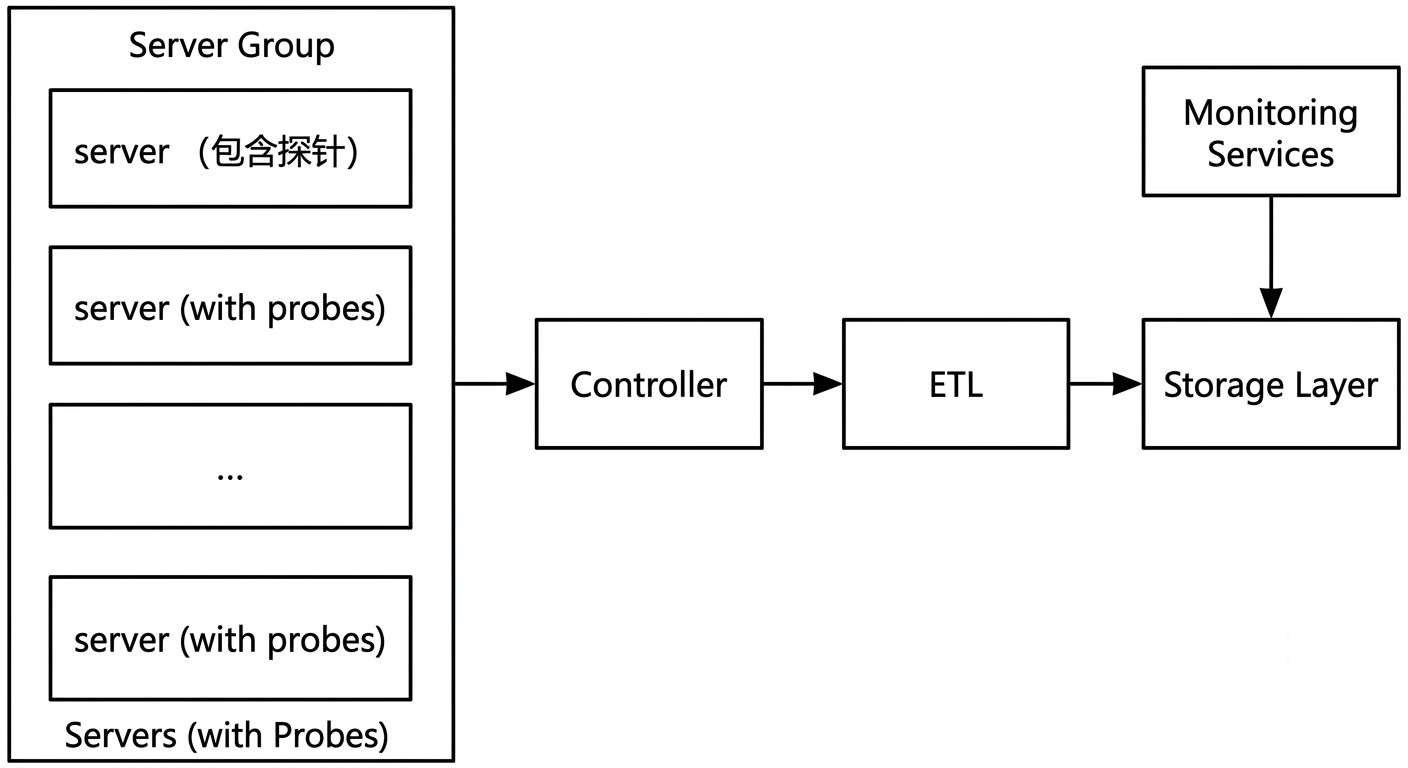
Logs, metrics, and distributed tracing are the three pillars of successful observability. Their implementation depends heavily on data collection. Agents (probes) collect and report data, which is then received and processed by backend services. Through ETL processing, the data becomes the foundation of observability analysis.
Typically, server performance data, service-related data, and inter-service call data are collected by probes and processed into observability insights after ETL.
The volume of probe-collected data depends on two key factors:
Sampling rate: The higher the sampling rate, the larger the data volume, and the more comprehensive the observability analysis becomes.
Business call volume: Higher service invocation frequency leads to significantly larger data volumes, making observability analysis more complex.
What Makes Supporting 2,000 Probes Challenging?
Due to resource constraints in private deployments, systems must support as many monitoring requirements as possible under limited infrastructure.
Bonree Data’s internal testing typically uses a 5-node cluster as the baseline deployment model. Under fixed resources, increasing the number of probes introduces several key challenges:
Business traffic exhibits peak fluctuations, with peak loads more than twice that of off-peak periods
Multiple types of business data are stored simultaneously, including tracing data, metrics data, and service snapshot data
The 5-node cluster is a mixed deployment environment, including multiple services such as data ingestion controllers, alerting services, query services, tracing storage, snapshot storage, metrics storage, and messaging middleware
Under high write loads, CPU, memory, and disk I/O become heavily contended resources, directly impacting system stability.
How to Optimize and Streamline the System
To address these challenges, the first step is system slimming, reducing the number of service components to minimize resource contention.
The second step is storage migration, replacing high-consumption components with more efficient alternatives.
The third step is storage optimization, improving the performance of storage services under a reasonable data architecture to ensure query stability.
Reducing Component Complexity
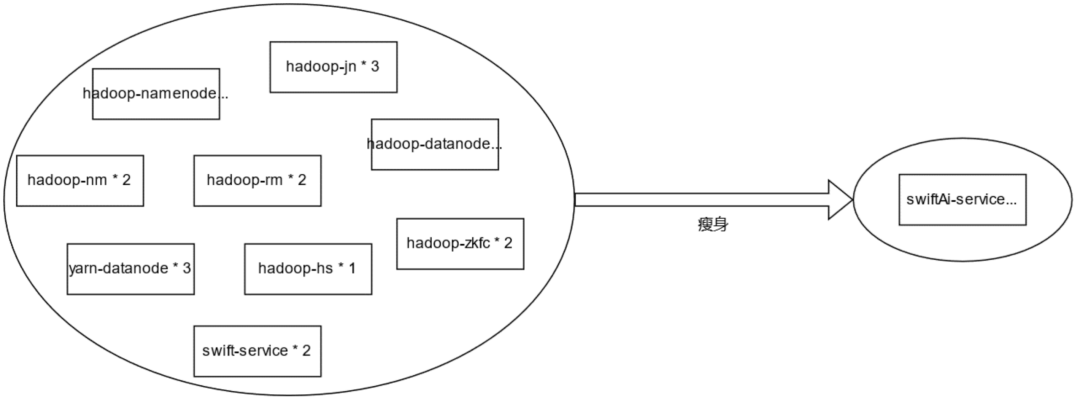
The Hadoop storage stack contains many nodes and is Java-based, resulting in high memory and resource consumption.
Its primary consumer is the AI service. Based on a self-developed data processing framework, the AI team has built a new generation service called SwiftAI, which reduces component types to a single service and requires only two nodes for deployment at minimum.
Storage Optimization
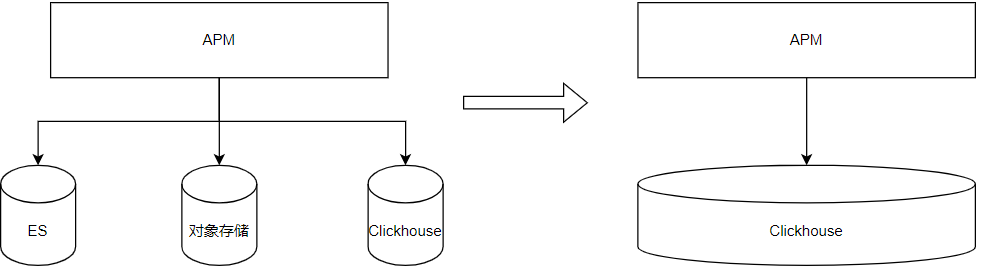
The current APM storage system consists of three major parts:
Metrics data
Tracing data
Snapshot data
These are currently supported by different storage systems:
ClickHouse for metrics
Elasticsearch (ES) for tracing
A self-developed object storage system for snapshots
In real-world scenarios, these systems are accessed in a mixed manner, making resource estimation difficult and increasing operational complexity.
Deploying multiple storage engines on a single machine can negatively impact system stability. Therefore, reducing storage components is a highly viable optimization approach.
Pain Points of ES-based Trace Storage
Inconsistent write timing between tracing data and associated snapshot data, leading to write latency
High resource consumption, especially CPU and I/O, impacting system stability
Unstable query performance, degrading significantly as data volume increases and sometimes becoming non-queryable
Pain Points of Object Storage for Snapshots
Unstable writes with occasional spikes
High CPU and I/O consumption, easily reaching performance bottlenecks
Migration to ClickHouse
To address these issues, both tracing and snapshot data were migrated to ClickHouse, resulting in the following benefits:
Tracing data and associated snapshot data are written into ClickHouse simultaneously, ensuring data consistency
Stable write performance with relatively low resource consumption, even for backfill workloads
Stable read performance with support for query throttling and resource limits, improving query reliability
Batch ingestion strategies ensure stable resource usage with minimal performance spikes
Storage Service Optimization
After consolidating storage services, ClickHouse bears increased load, making its optimization and observability even more critical.
We focused on three main optimization directions:
1. Service Parameter Tuning
max_bytes_before_external_group_by:
When memory usage exceeds this threshold during GROUP BY operations, intermediate data is spilled to disk for processing. Typically set to ~80% of available memory.max_bytes_before_external_sort:
Similar to above, used for ORDER BY operations to offload data to disk when memory is insufficient.max_memory_usage:
Maximum memory allowed per query, typically set to ~80% of total memory.max_execution_time:
Maximum execution time per query, configured based on business response time requirements.
2. Use of Materialized Views, Indexes, and Projections
Different acceleration strategies are used depending on the scenario:
High-frequency queries leverage primary key indexes
Queries not optimized by primary keys use secondary indexes
Sorting-heavy queries use projections and materialized views, with projections preferred when applicable
Materialized views are used when projections are not suitable
3. Monitoring and Fault Tolerance
To manage complex multi-service integration, strong monitoring and fault tolerance mechanisms are required.
Monitoring
Track both write and read metrics, such as write volume per minute, write latency, and query QPS
Monitor node-level metrics such as load, merge tasks, and number of parts to detect stability risks early
Monitor cluster balance, including replication lag, query distribution, and write distribution to avoid data skew
Fault Tolerance
Failure of a single write node does not affect overall write availability
Failure of a ClickHouse node does not impact overall cluster read or write operations
Results
AI components have been streamlined
Tracing and related data have been migrated to ClickHouse
To support 2,000 probes on a 5-node cluster, the first priority was simplification—reducing inter-component dependencies and maximizing the efficiency of each service.
Around this streamlined architecture, a more comprehensive ecosystem was built, including monitoring, operations, and management interfaces.
Further optimization continues around real-world business scenarios to ensure system stability.
In the future, we will continue to explore deeper optimizations at the ClickHouse kernel level and share our practices with the developer community. This will further enhance Bonree ONE in terms of speed, accuracy, and stability.