




Business chain observability puts business metrics, service performance, alerts, and distributed traces on the same transaction path, so teams can move from noticing an anomaly to explaining it. In Bonree ONE, this view is paired with Sage AI, which turns scattered signals into a ranked, verifiable list of where to investigate first.
One Business Symptom, Many Possible Causes
A single payment passes through order placement, inventory checks, and payment processing, and each step can involve several services and APIs. A slow node or a failing interface at any point can show up as the same symptom: a lower payment success rate.
The people looking at that symptom need different answers. A business owner wants to know which transactions are affected. An on-call engineer wants to know which call is failing and whether a recent change to the chain is involved. A metrics dashboard alone cannot answer both.
Why a Single Dashboard Is Not Enough
Each type of signal answers only part of the question:
Business metrics show the outcome.
Service metrics describe the state of one component.
Alerts say when something went wrong.
Traces record the path a request took.
Only when these are placed on one business chain can a team explain an anomaly rather than just detect it.
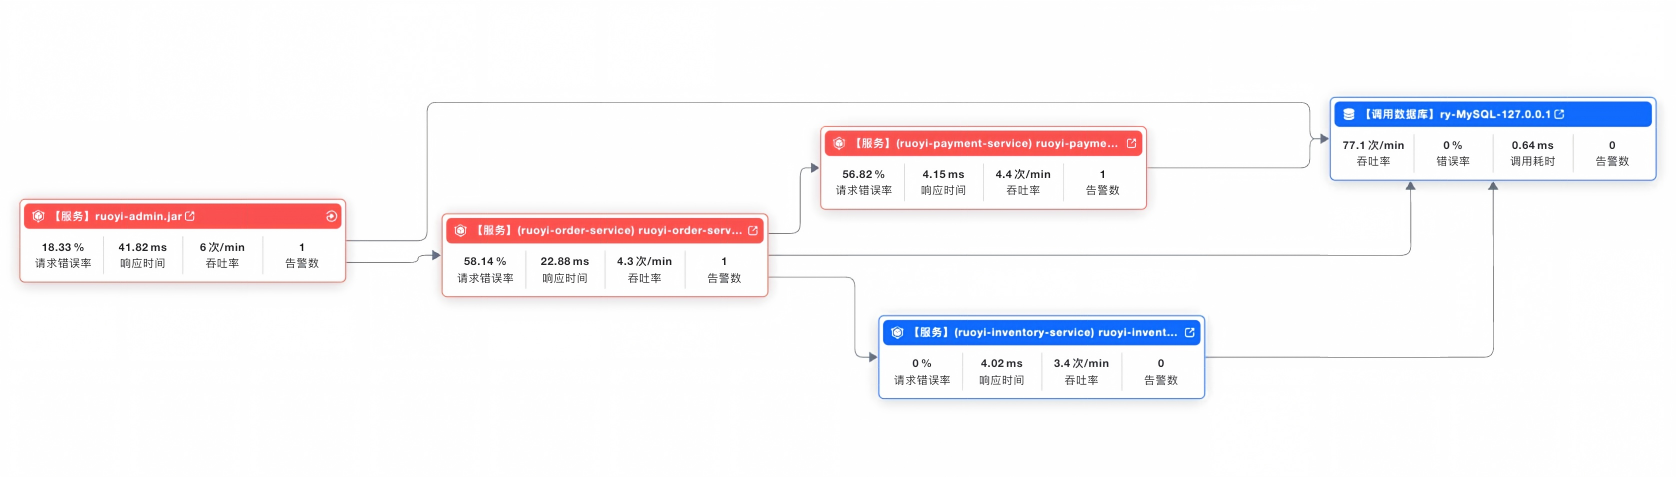
Consider a failed payment. It may touch the entry service, order service, payment service, inventory service, and a database. An elevated error rate on one service does not tell you whether that service is where the problem started or merely where an upstream failure arrived. Troubleshooting therefore starts with three questions:
How large is the business impact? Are payment success rate, transaction volume, and order completion rate moving together?
Where on the chain is the anomaly? Which nodes saw their error rate or response time change first?
Has the chain itself changed recently? Were nodes added, dependencies altered, or interfaces modified?
Putting the questions in this order keeps engineers from jumping between signals that all look abnormal.
Business Metrics and Call Performance on One Screen
A chain is not healthy simply because its services are running. If payment success rate falls while transaction volume swings sharply, the business explanation differs from a case where volume is steady. If order completion rate drops at the same time, the failure may have spread through the whole transaction loop and needs a closer look.
In Bonree ONE’s runtime view, outcome metrics (payment success rate, transaction volume, order completion rate) sit next to diagnostic metrics (response time, error rate, throughput, and alert status). The first group tells you whether users’ transactions are affected. The second tells you which part of the call path is slowing down, failing more often, or absorbing a shift in traffic. Once an anomalous signal lands on a specific node, the search narrows from the entire chain to the few branches worth checking first.
The same view supports recovery checks. After a fix is deployed, engineers should return to the business metrics and confirm that payment success rate has recovered. They can then look at node-level error rate and response time to judge whether the problem is actually resolved.
How Sage AI Helps: Turning Scattered Signals into Leads You Can Check
When many nodes and metrics alert at once, engineers rarely need more charts. They need a short explanation of where to look first and why.
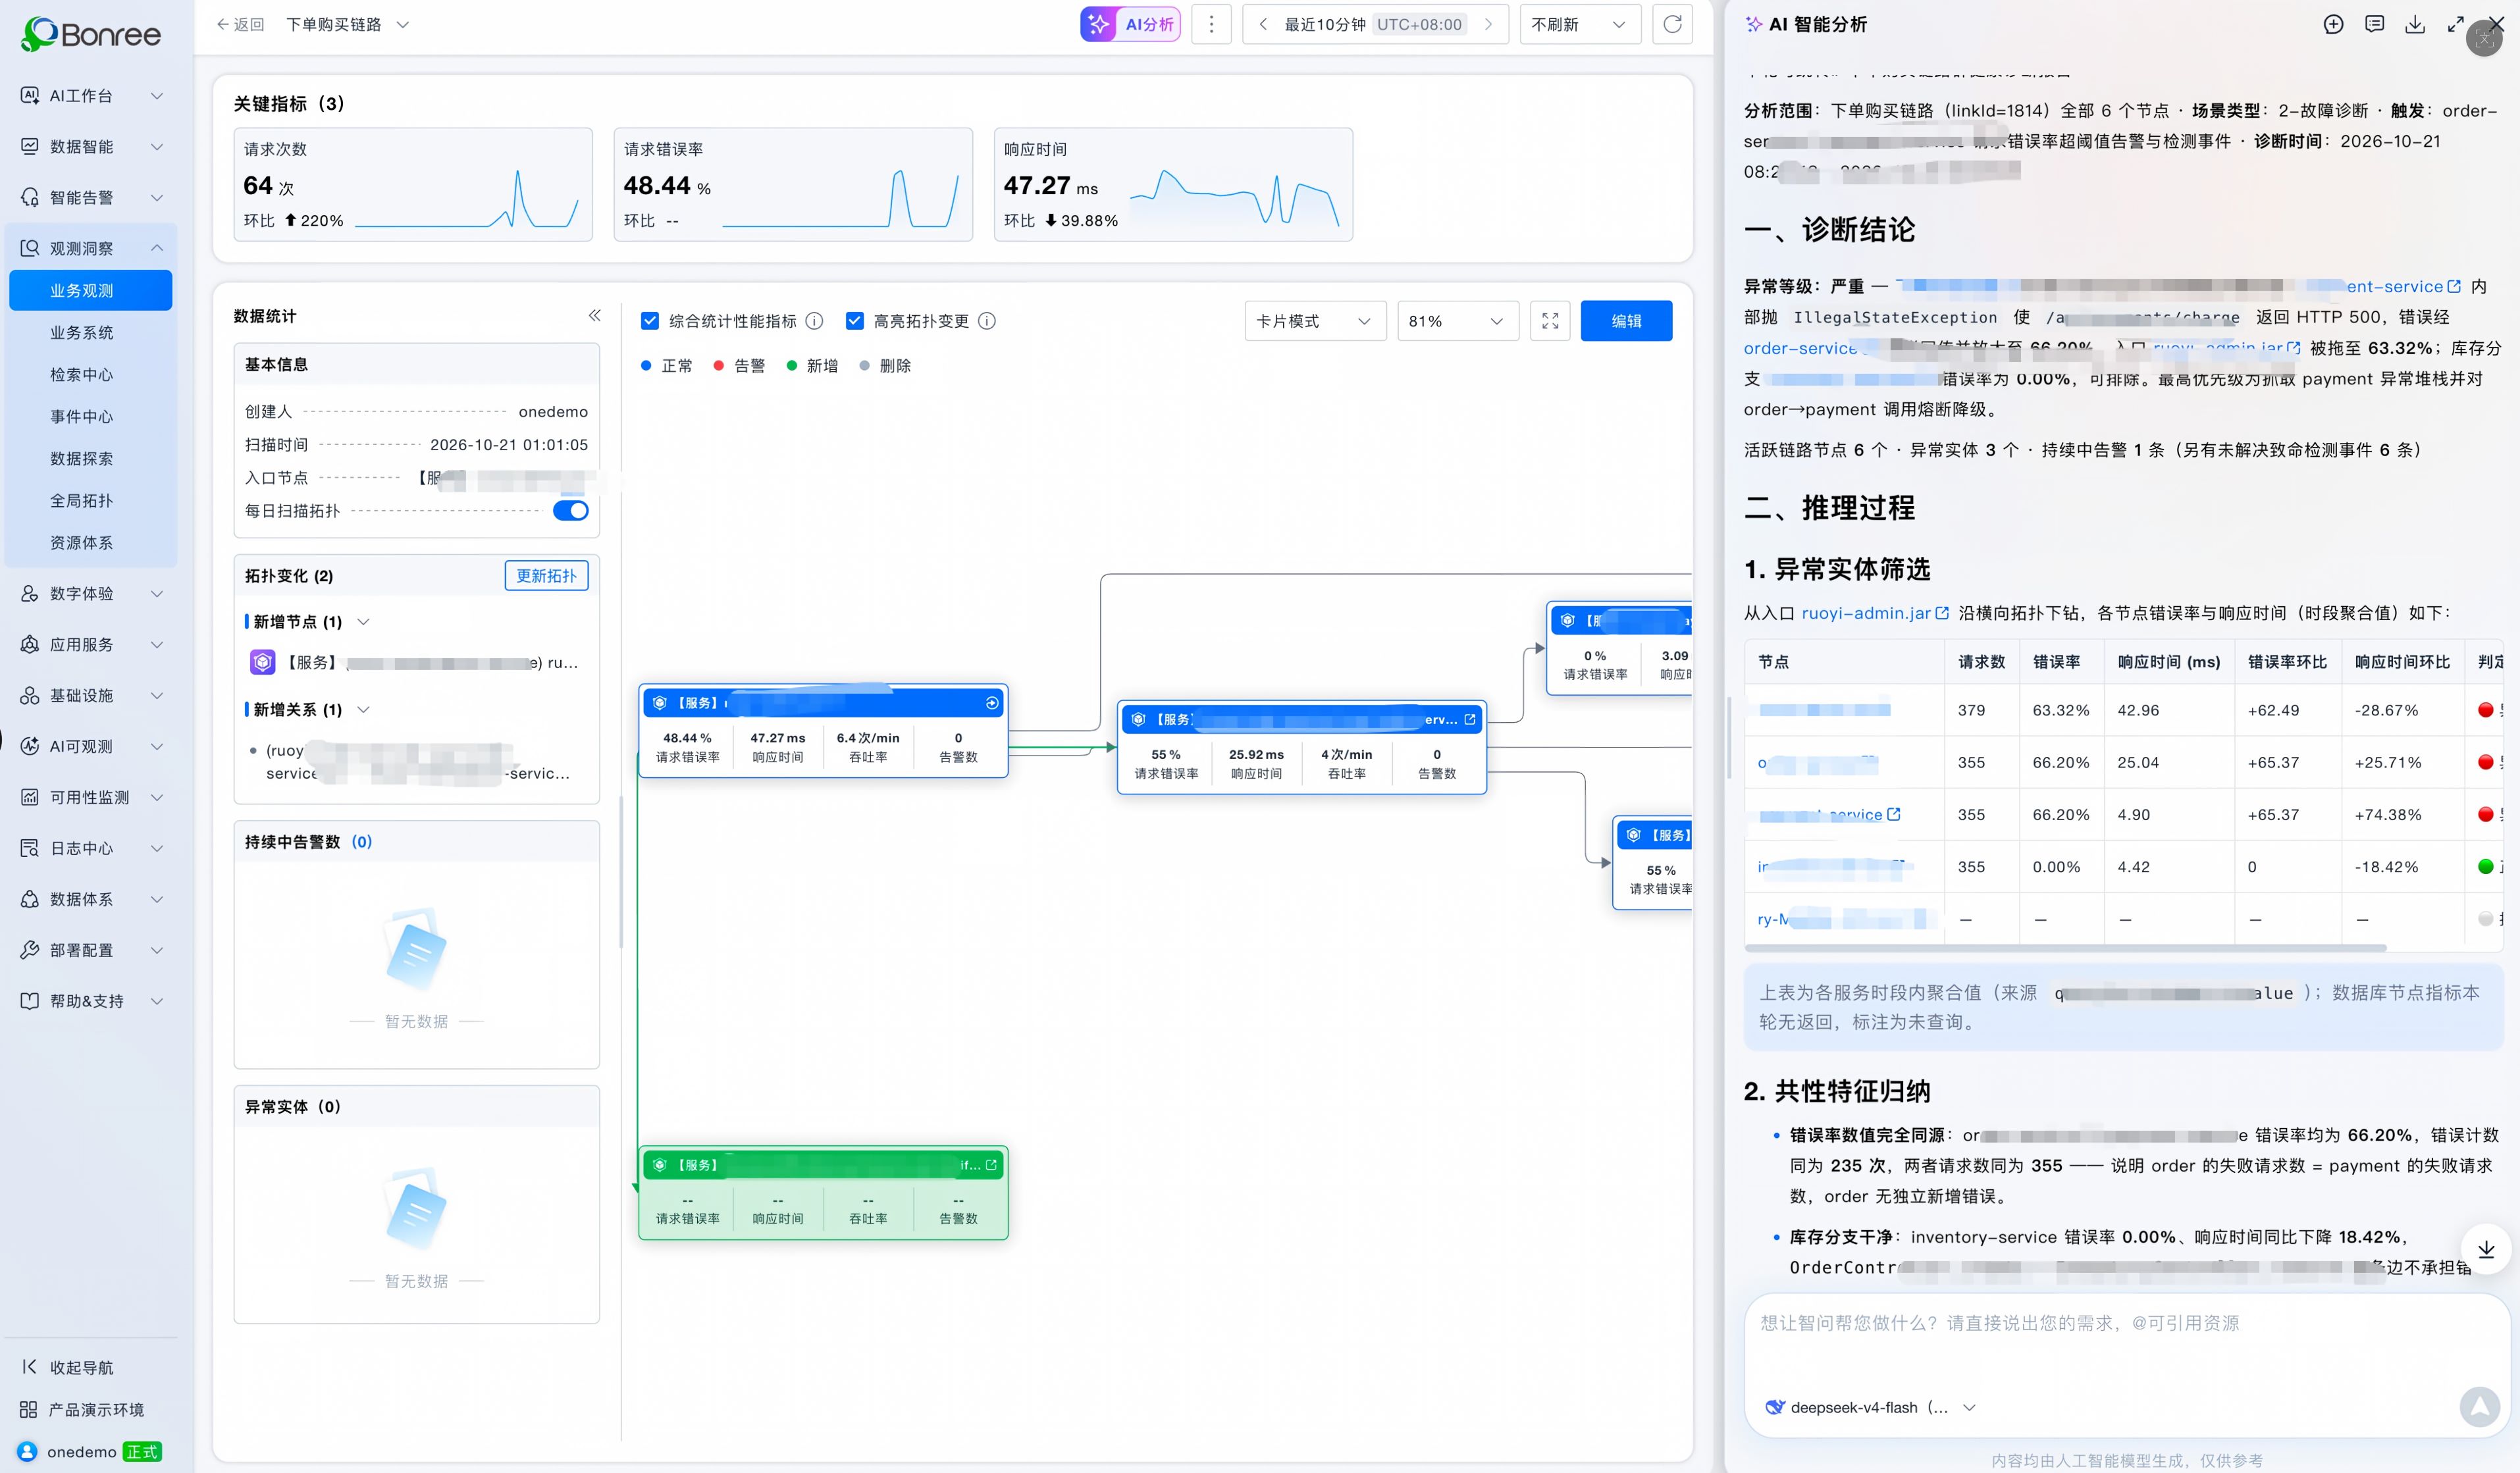
Sage AI works within the scope of a business chain. It gathers the affected entities, key metrics, alert events, and upstream and downstream relationships, then produces a diagnostic conclusion, the reasoning behind it, and a suggested order of investigation.
Its role is to organize evidence and sequence the work. Alerts and metrics show when an anomaly began and where it is concentrated. Logs and traces then verify the specific requests and the cause of the error. Any judgment not yet backed by raw data should be validated further and not recorded as a confirmed root cause.
A Four-Step Troubleshooting Workflow
Confirm the impact. Start with business signals such as payment success rate, order completion rate, and transaction volume. Establish whether users are failing to complete transactions, and define the affected time window.
Narrow the scope along the chain. Combine alerts, node error rates, response times, and call relationships to see which segment of the path the anomaly is concentrated in. Separate the primary anomalous nodes from upstream and downstream nodes that are probably affected as a side effect.
Drill down and verify. Follow the leads from Sage AI into stack traces, logs, and traces. Check the specific interfaces, requests, and error behavior until the cause is confirmed.
Confirm business recovery. After the fix, recheck key business metrics and node health. Troubleshooting is complete only when both the business outcome and the technical signals are back in a reasonable range.
What Teams Gain
Clearer business impact. Starting from outcome metrics such as payment success rate, teams first establish whether real transactions are affected and then tie that scope to technical events. Conversations with business owners move beyond “a service is throwing errors” to which user flow is affected and how.
A more focused investigation. The chain links services, interfaces, and dependencies. Metrics and alerts indicate when and where the anomaly appeared. Sage AI summarizes the evidence and proposes an order of checks. Engineers can verify the best-supported branch first and widen the search only as needed.
Results that can be reviewed. Each step, from detecting the anomaly to checking logs and traces to confirming business recovery, rests on data. During collaboration and post-incident review, a team can reconstruct why a given node was prioritized and whether the business actually recovered after the fix.
Takeaway
Business chain observability is more than a diagram that connects services. It gives business impact a traceable path, gives technical anomalies a business context, and lets AI analysis propose leads, based on chain structure, metrics, and alerts, that engineers can verify. Business teams can see sooner which transactions are affected. Technical teams can organize their investigation by chain priority and use data to confirm the outcome.
Bonree ONE combines chain orchestration, runtime observability, and AI-assisted analysis in one scenario, so teams can collaborate around the same problem and reach faster diagnosis and more timely resolution.
FAQ
What is business chain observability?
It is the practice of viewing business metrics, service performance, alerts, and distributed traces together on one business transaction path. Instead of checking each signal in a separate tool, teams see how a business outcome, such as payment success rate, relates to the services and calls behind it.
Why isn’t a service metrics dashboard enough to troubleshoot a payment success rate drop?
Service metrics describe the state of individual components, and they do not show how those components relate to the business outcome. An elevated error rate on one service may be the origin of the problem or the result of an upstream failure. Placing metrics, alerts, and traces on the same chain makes it possible to tell the difference.
Which metrics are used together in this approach?
Business metrics such as payment success rate, transaction volume, and order completion rate are viewed alongside response time, error rate, throughput, and alert status. The first group shows whether transactions are affected, and the second helps locate the segment of the call path involved.
Does Sage AI identify the root cause automatically?
Sage AI analyzes the business chain and produces a diagnostic conclusion, the reasoning behind it, and a prioritized direction for investigation. It is meant to organize evidence and sequence the work. Engineers then use logs and traces to verify specific requests and error causes, and a judgment not yet supported by raw data is not treated as a confirmed root cause.
How do you confirm that a problem is really fixed?
Return to the business metrics and check that payment success rate and related outcome indicators have recovered. Then review node-level error rate and response time. The investigation is closed only when both business results and technical signals are back within a reasonable range.