





Release date: November 16, 2026
Bonree ONE 4.0.4.0 is now available. This update expands agent diagnostics and data integration, improves the creation, usage, and operations experience of the AI Workbench, and adds new troubleshooting entry points to Resource System instance observability, intelligent alerting, log queries, and analysis dashboards.
Click the link below to book a Bonree ONE product demo
https://www.bonree.com/s/one
Product Updates
AI Workbench
User conversation memory. Sage AI can now remember background information from user conversations and refer to it in later exchanges. For ongoing investigations and multi-round collaboration, this reduces the need to repeat the same context and improves the efficiency of continuous dialogue and problem analysis.
Suggested inputs for AI-created Skills. Requirements are organized around fields such as target scenario, MCP tools, workflow, emergency plan, and long-term recommendations. With one click, the suggested content is filled into the chat input box and sent once confirmed. This gives Skill creation a clear description framework and reduces back-and-forth caused by missing key requirements.
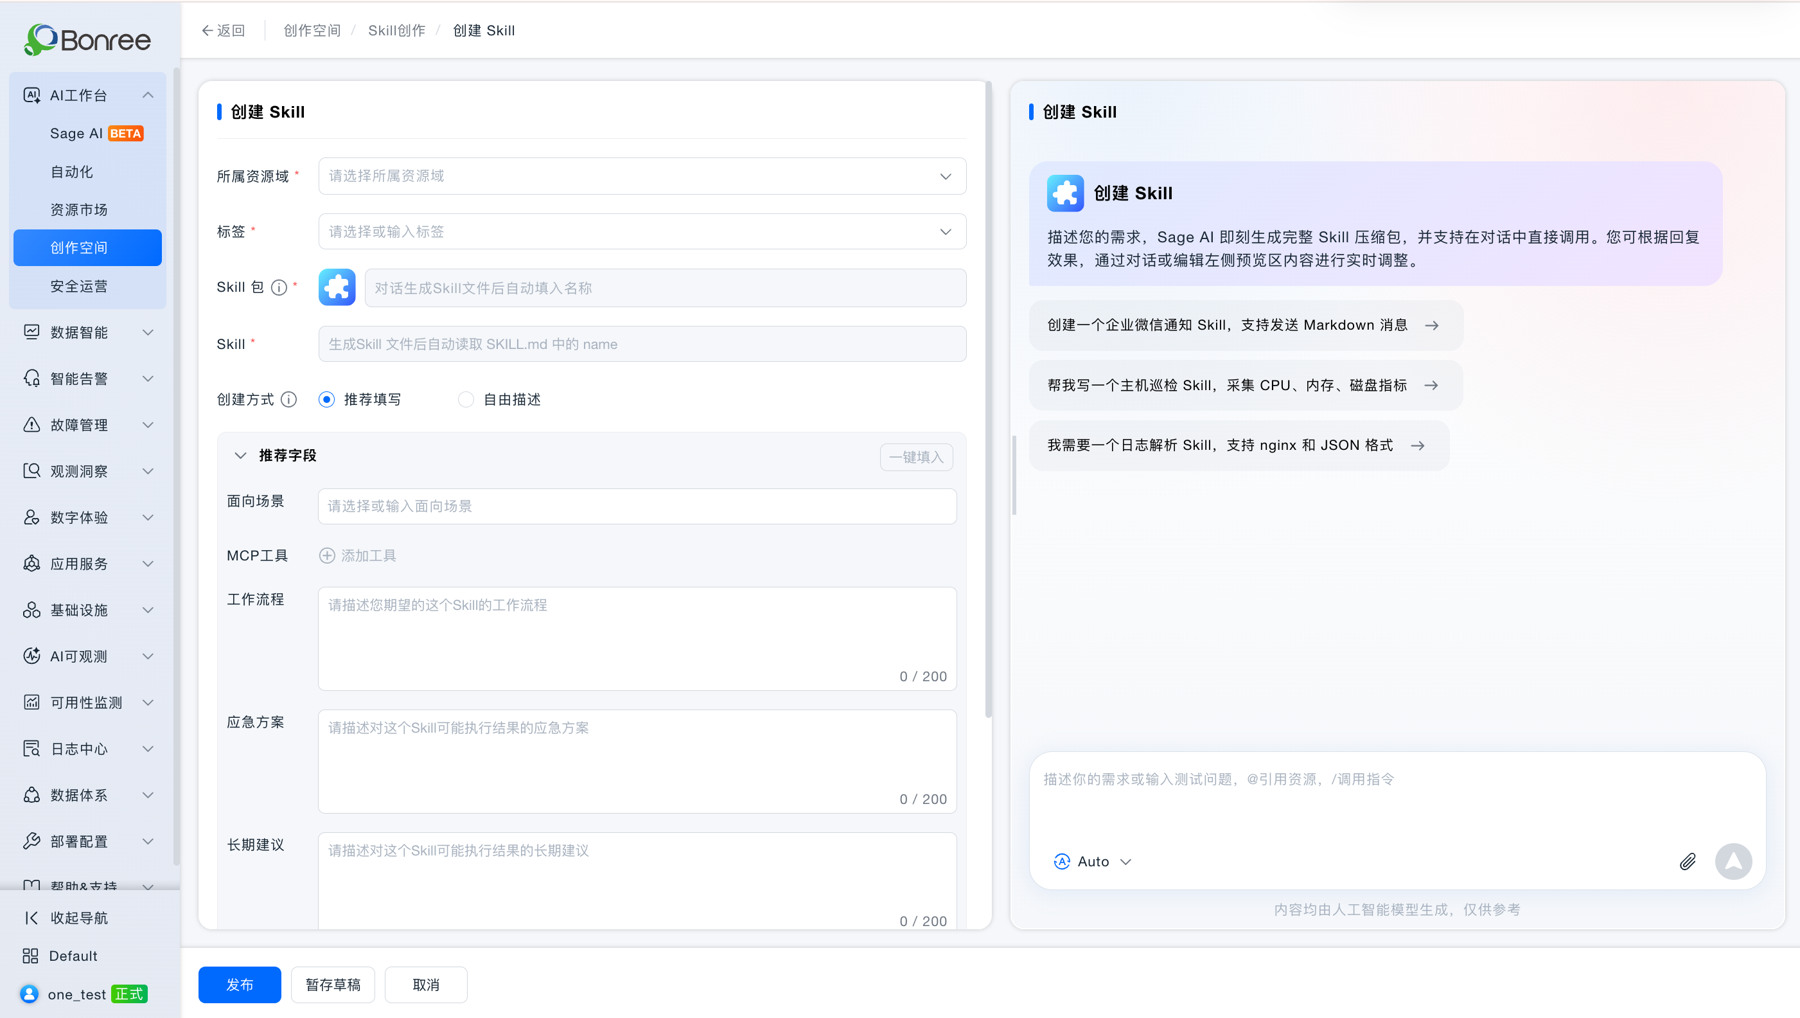
AI-Created Skill: Suggested Inputs
New import records. The automation, knowledge base, Skill, and agent lists now include import records, showing file names, validation results, execution status, and import outcomes. Both successful and failed imports are logged after confirmation, making it easier to verify resources after cross-environment migration and track unfinished imports.
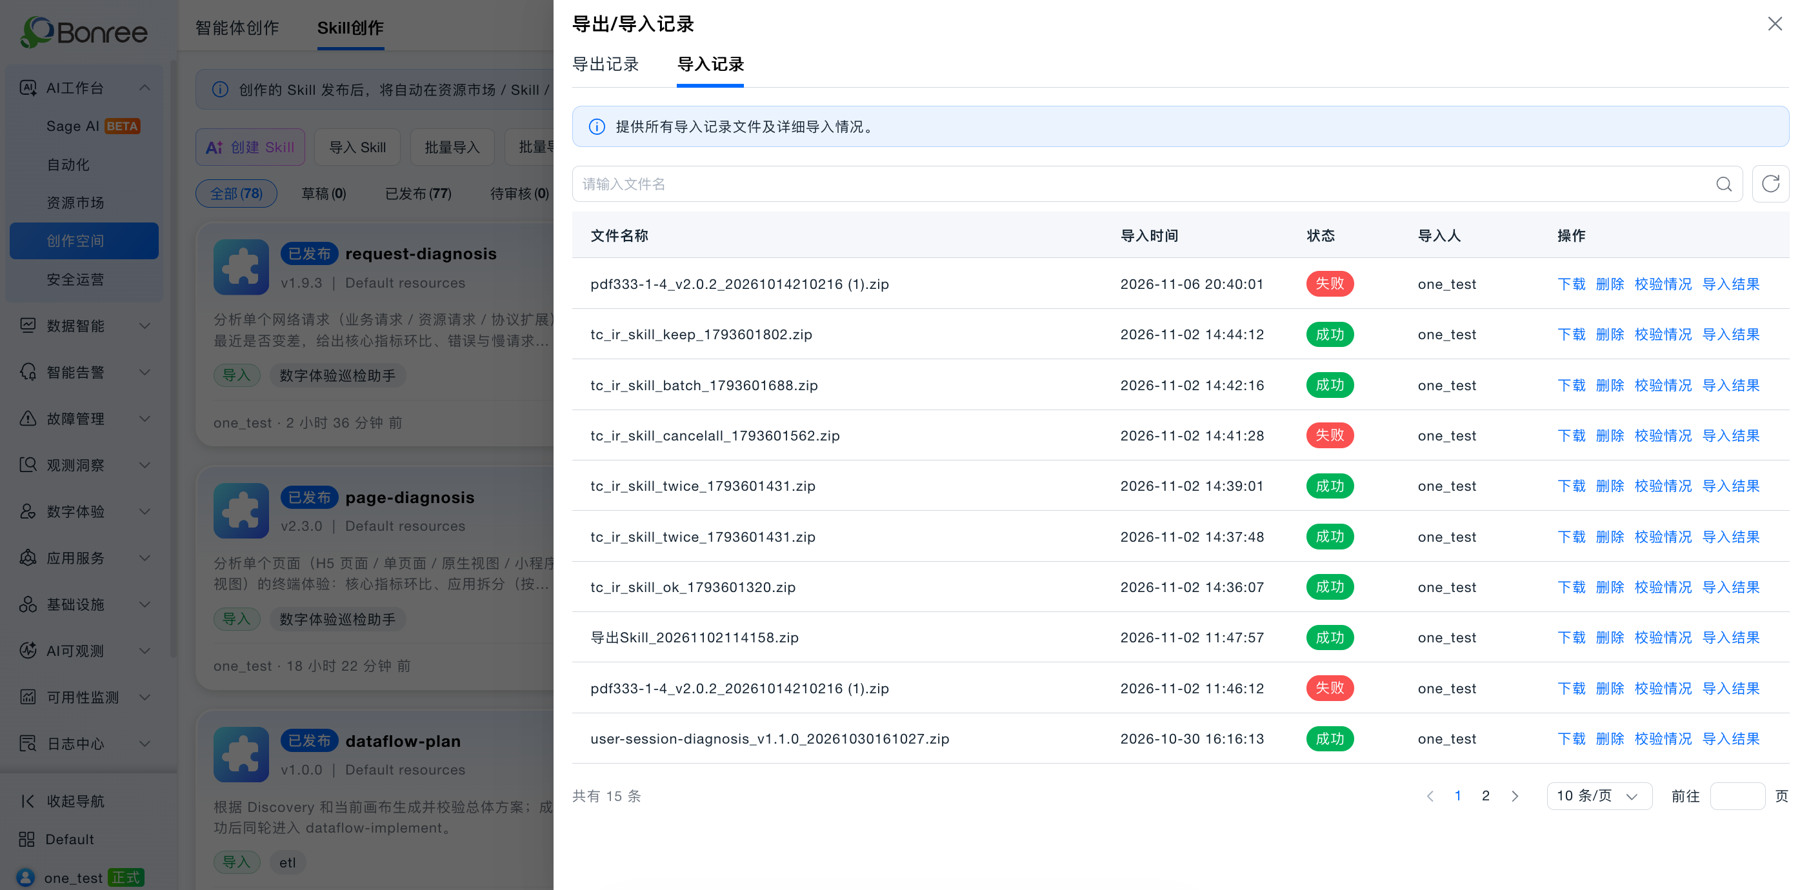
AI Resource Import Records
Continued generation and time review in conversations. Answers in progress keep generating after you switch sessions, leave Sage AI, or refresh the page. Hover over a question to see when it was sent; once an answer is complete, its output time is displayed, adjusted to the time zone set in the personal center. This reduces the impact of page switching on task viewing and makes it easier to compare when a question was asked with when the result was generated.
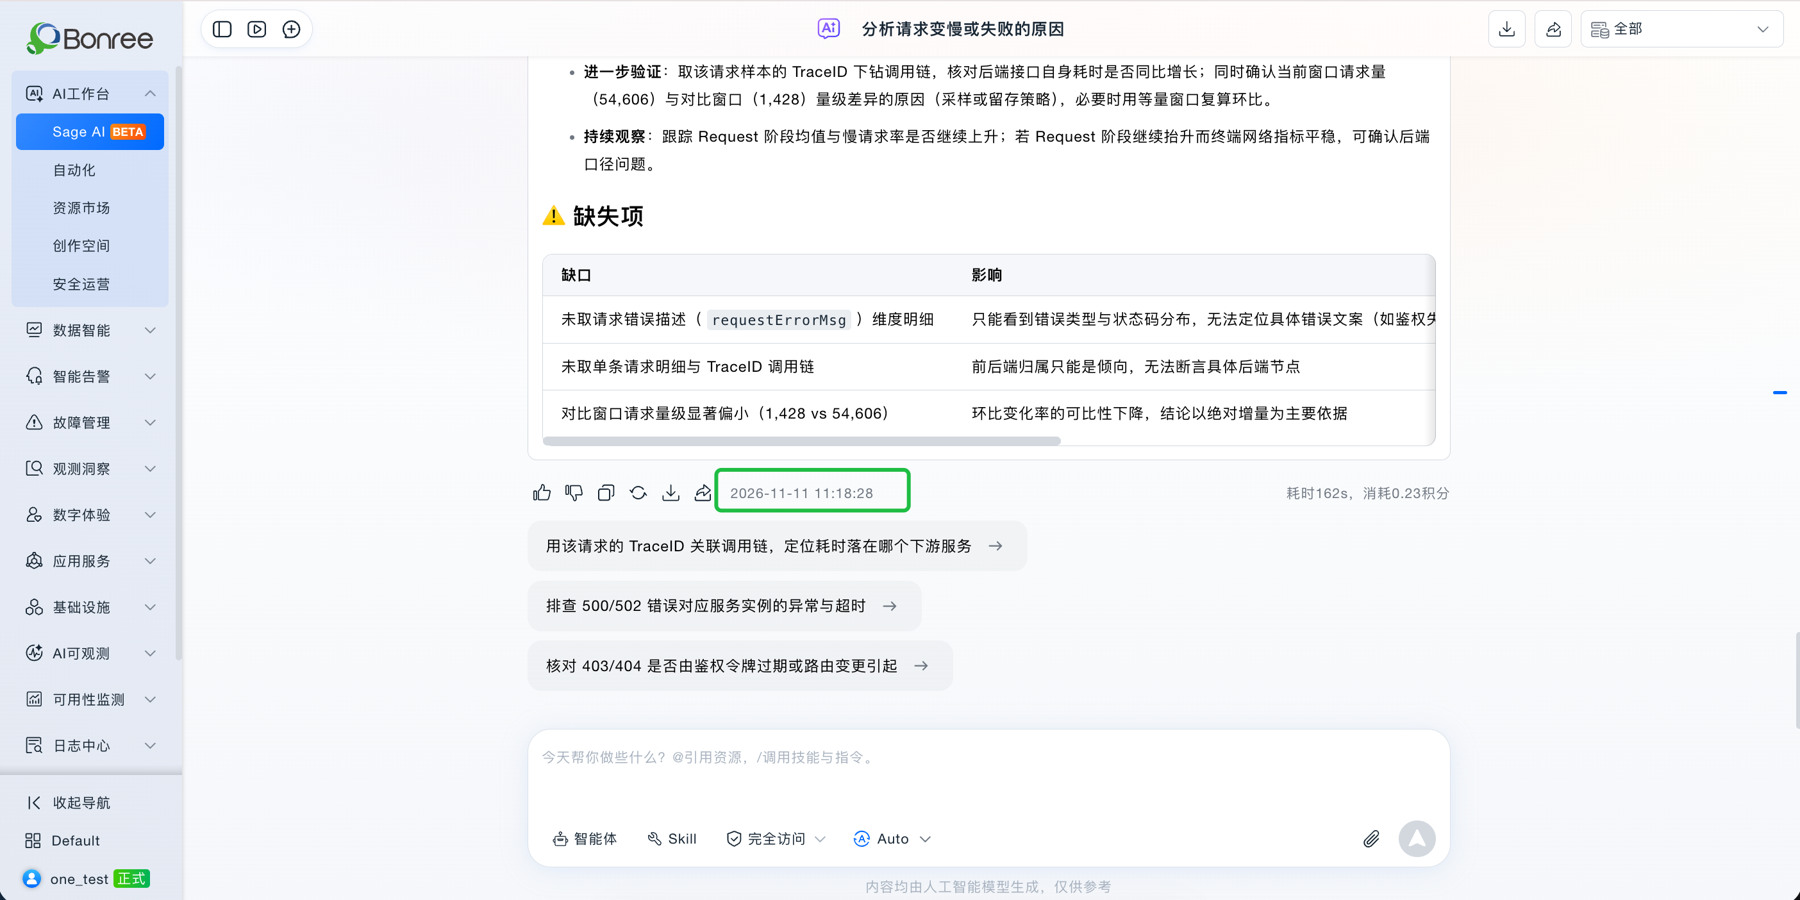
Sage AI Conversation Timestamps
User and consumption analysis in the operations overview. New active user and user call analyses support filtering by user and trigger source, with conditional jumps to audit logs. Session records now include token consumption. Administrators can see who is using the platform, where requests originate, and how much is consumed, providing a basis for team rollout and resource allocation.
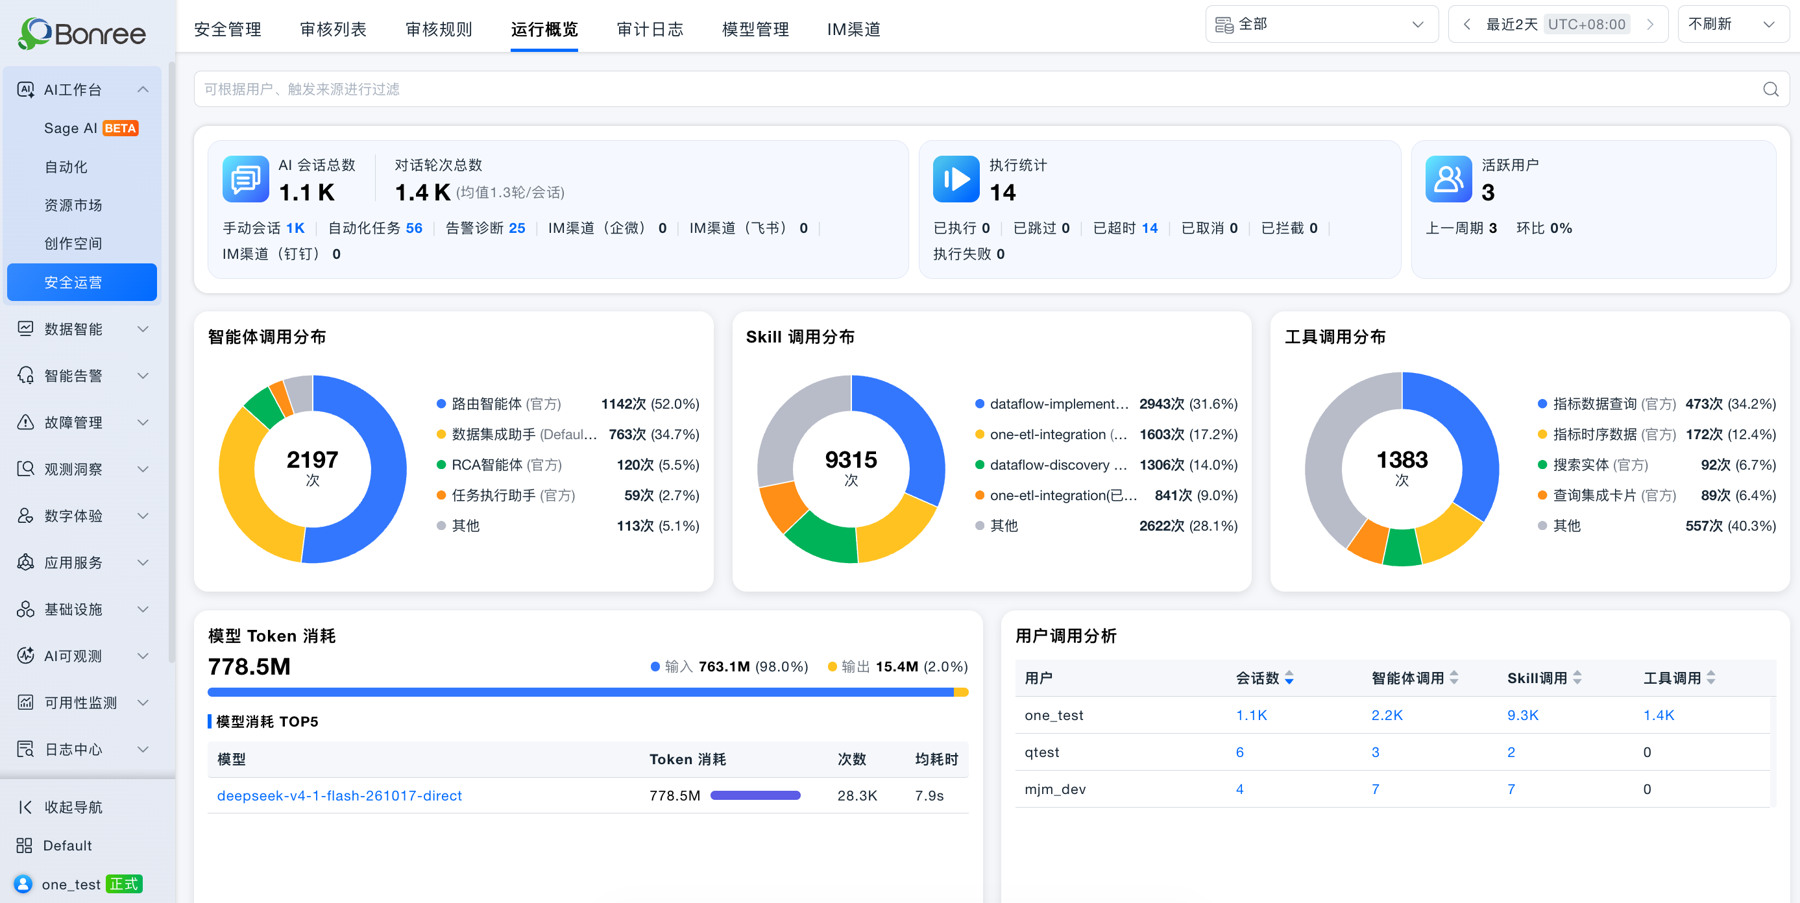
AI Workbench Operations Overview
Version rollback for agents and Skills. While editing, you can overwrite the current configuration with a historical version, which takes effect after saving as a draft or publishing, and publishing generates a new version. When a configuration change goes wrong, you can quickly restore a verified version without manually reverting parameters.
APM (Application Performance Monitoring)
Expanded agent capabilities. Sage AI now includes three preset agents: the Host Runtime Diagnostic Assistant, the System Service Diagnostic Assistant, and the Digital Experience Diagnostic Assistant. They diagnose host runtime anomalies, system service performance bottlenecks, and digital experience issues. System service diagnostics cover systems, services, service instances, and endpoints. When launched from a page, the assistant carries over the current object and time range and produces conclusions you can drill into. This removes the need to repeatedly supply background information and scattered analysis targets, improving the efficiency of health analysis and anomaly location.
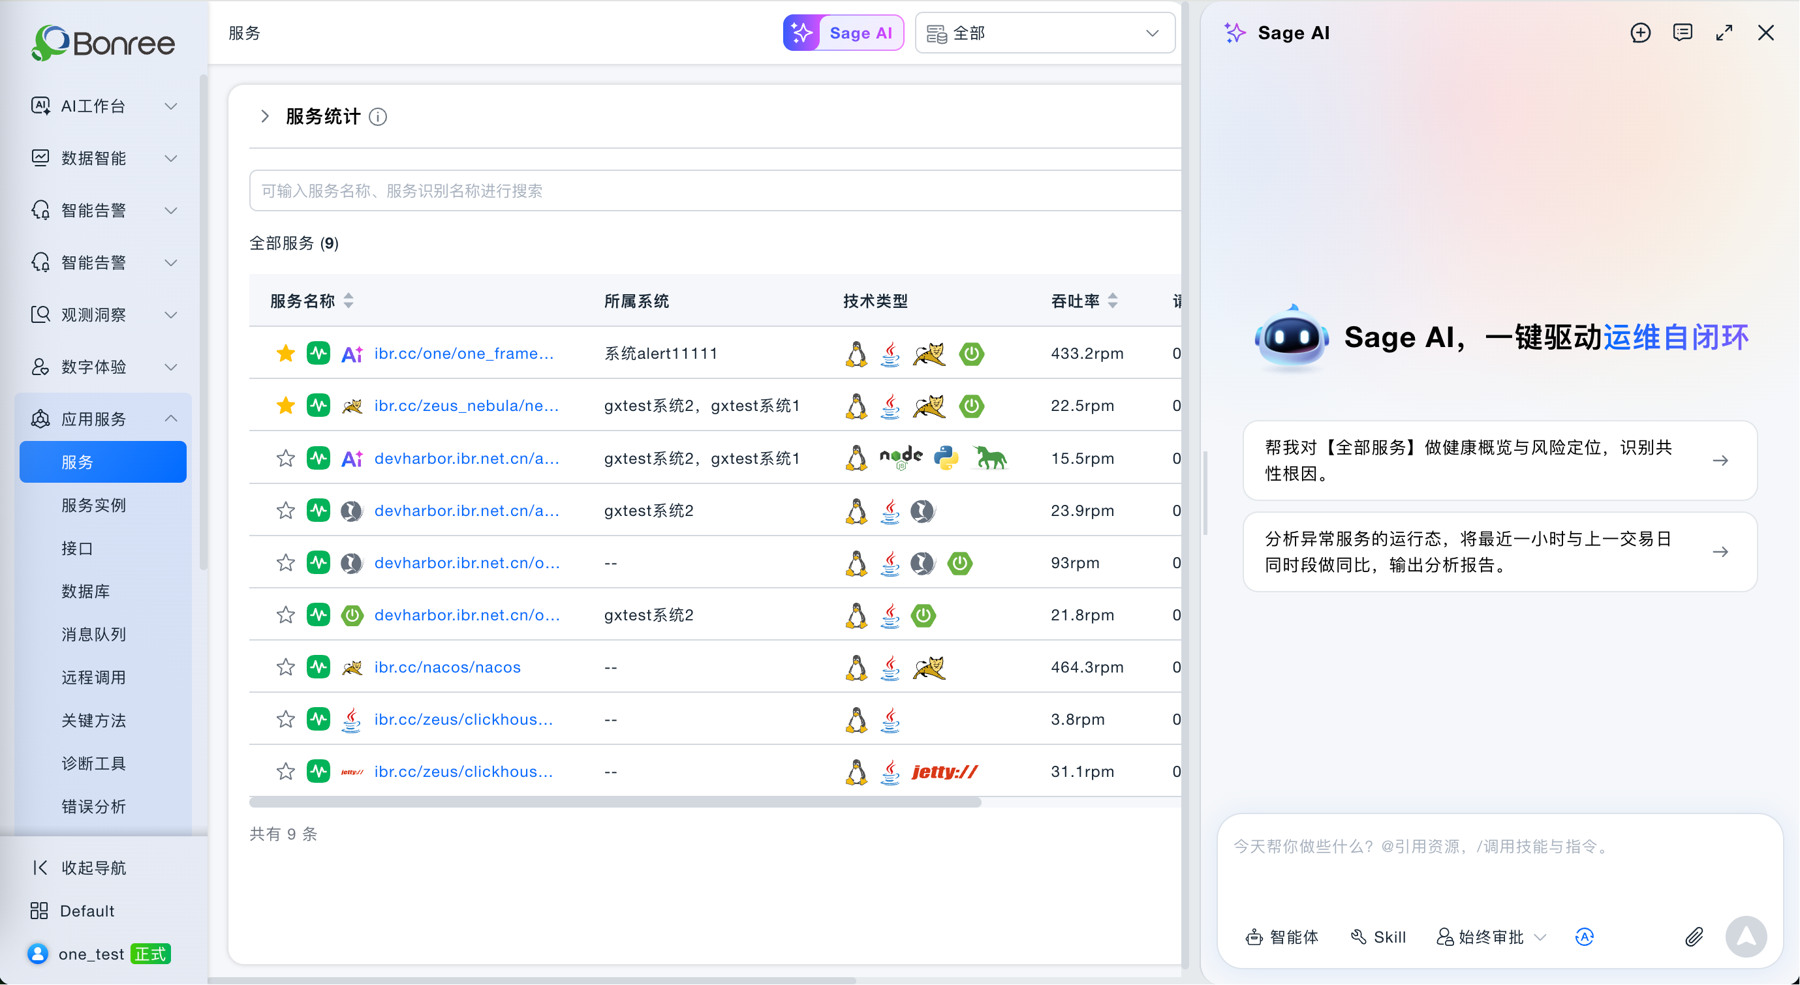
Host Runtime Diagnostic Assistant and System Service Diagnostic Assistant
Add views to business trace details. Existing dashboards or custom views can be mounted as tabs on the detail page and switched with the topology view. You can set a default view, rename it, or remove it. Putting trace structure and commonly used metrics in one place reduces switching between pages during troubleshooting.
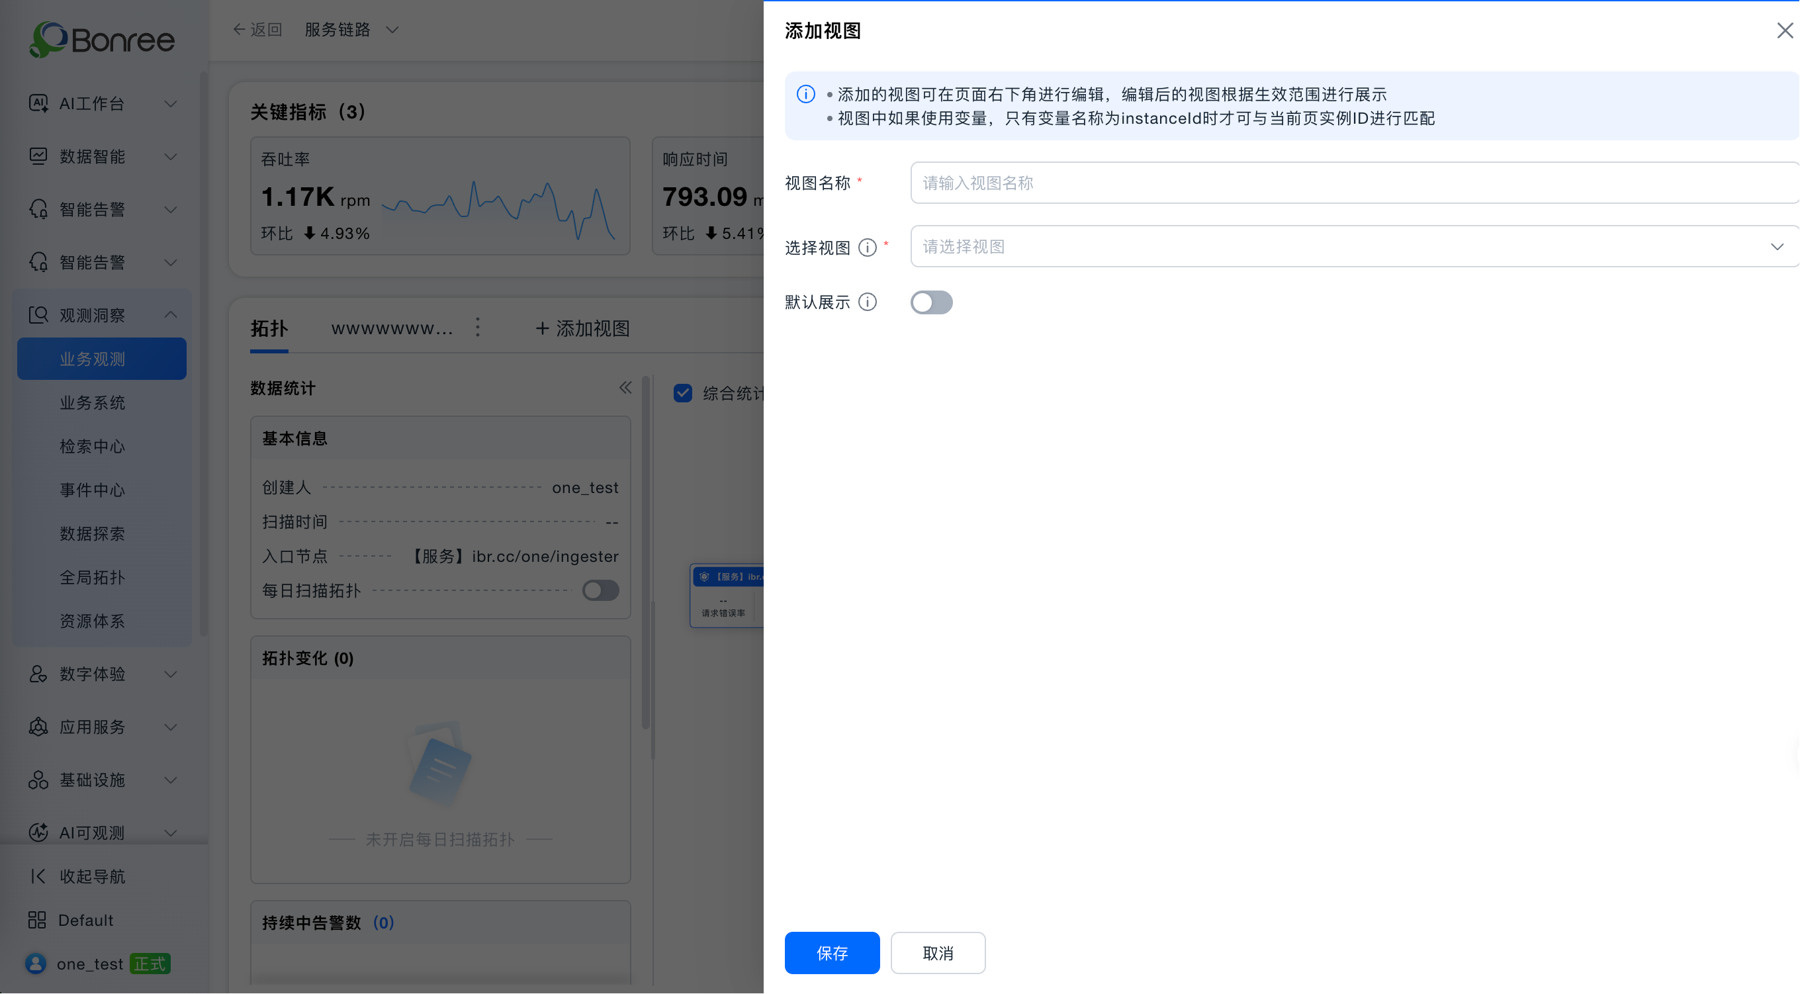
Adding Views to Business Trace Details
Endpoint metrics now distinguish call direction. Existing metrics are retained, and two new groups of 11 metrics each have been added: “Endpoint Called” and “Endpoint Initiating Calls.” Dashboards can filter and analyze by whether an endpoint acts as the caller or the callee, making it easier to separate inbound requests from downstream calls and narrow the scope of performance troubleshooting.
RUM (Real User Monitoring)
Expanded digital experience diagnostics. The Digital Experience Diagnostic Assistant provides an intelligent diagnostic entry point for abnormal end-user experience, helping teams analyze problems from the user experience dimension. Working alongside host runtime and system service diagnostics, it adds a client-side perspective and improves cross-layer analysis and problem location.
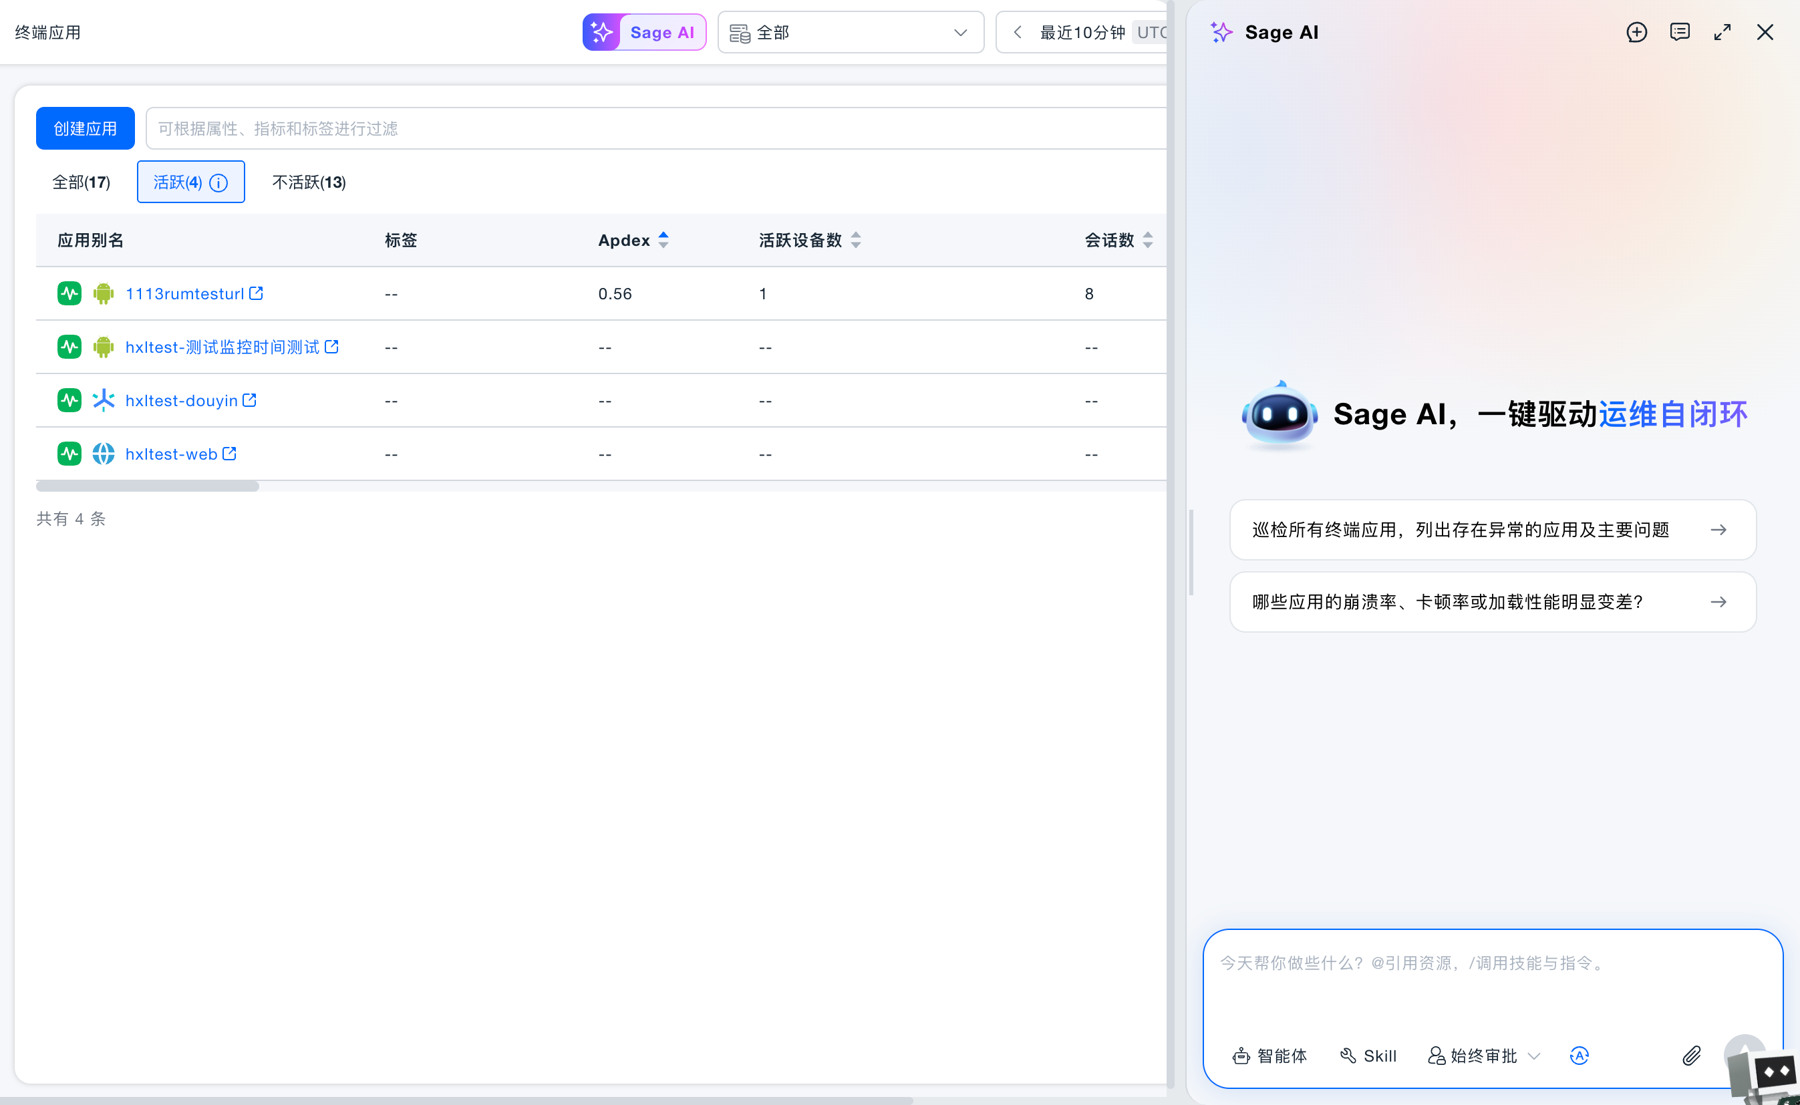
Digital Experience Diagnostic Assistant
Automatic instrumentation for the HarmonyOS SDK. Automatic instrumentation is now supported for HarmonyOS, and the Android and HarmonyOS SDKs support custom collection of data from higher system versions. This reduces the integration effort for client-side collection and makes it easier to cover experience across different system versions.
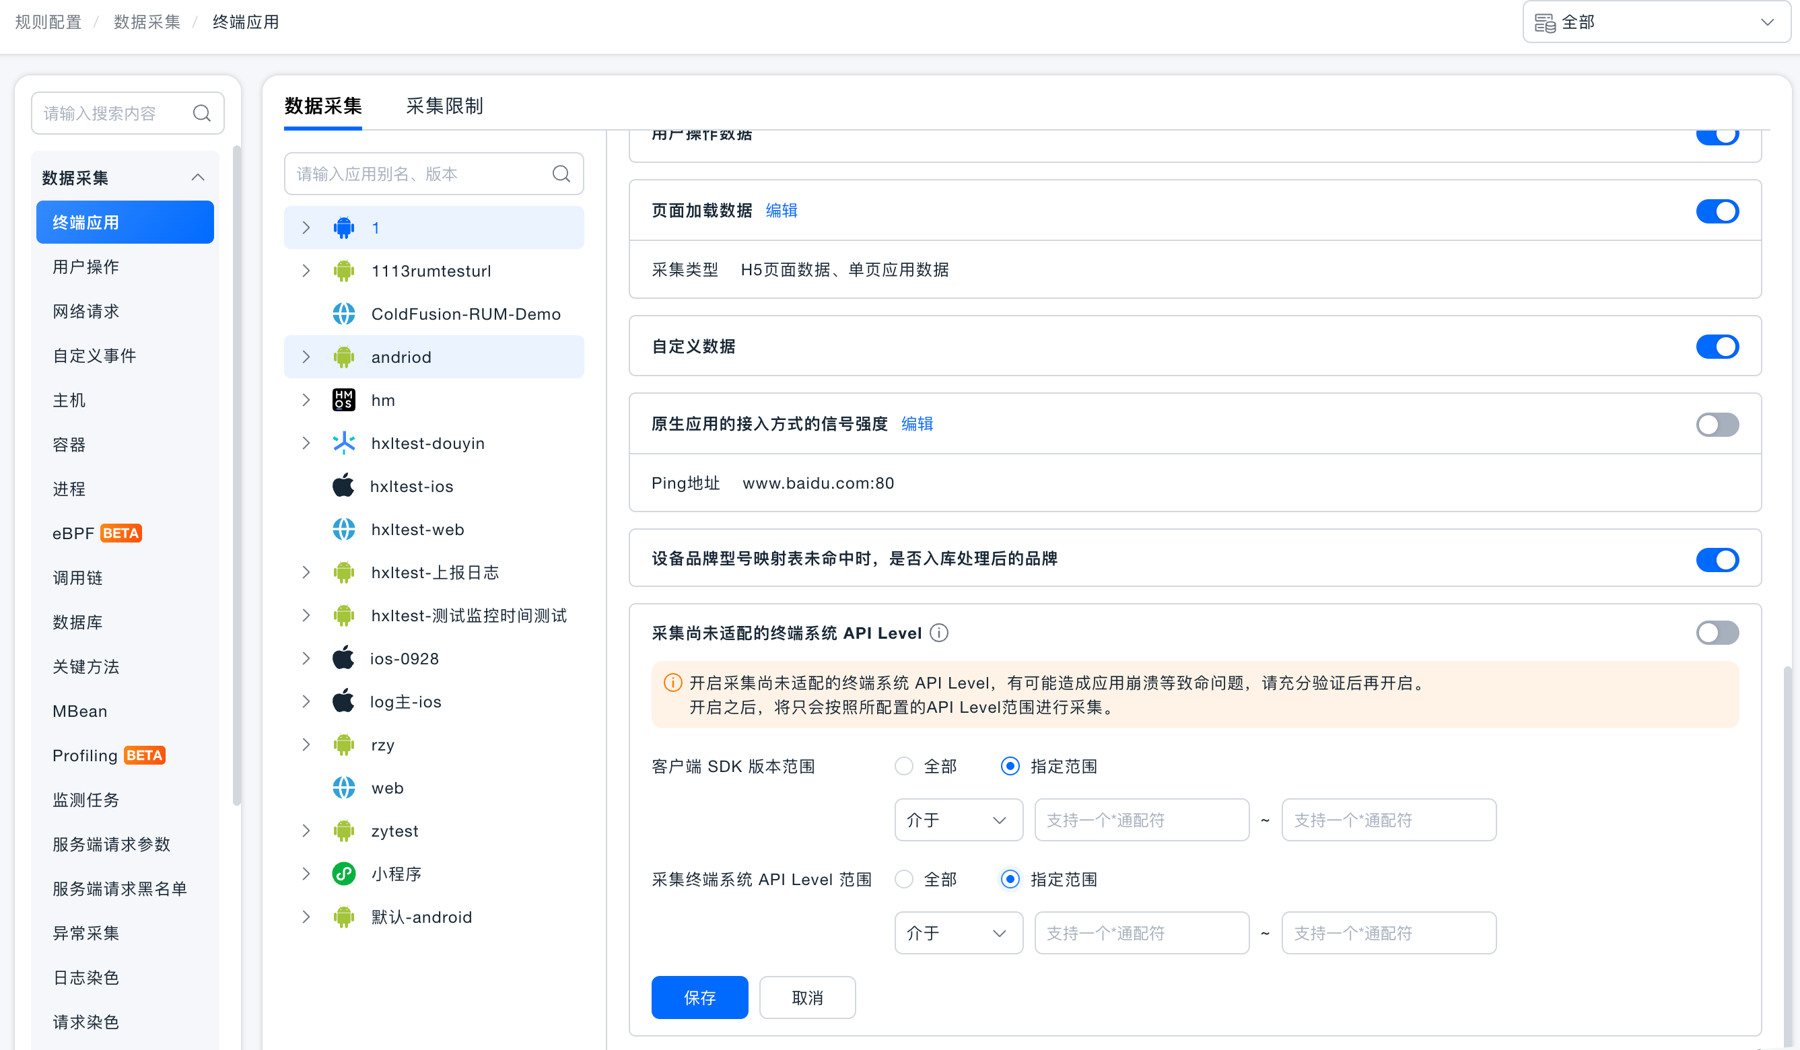
Custom Collection Configuration for Client SDKs
MAC address in session details. The MAC address can now be viewed in user session details, providing additional information for device verification and making it easier to confirm the affected terminal against existing device records.
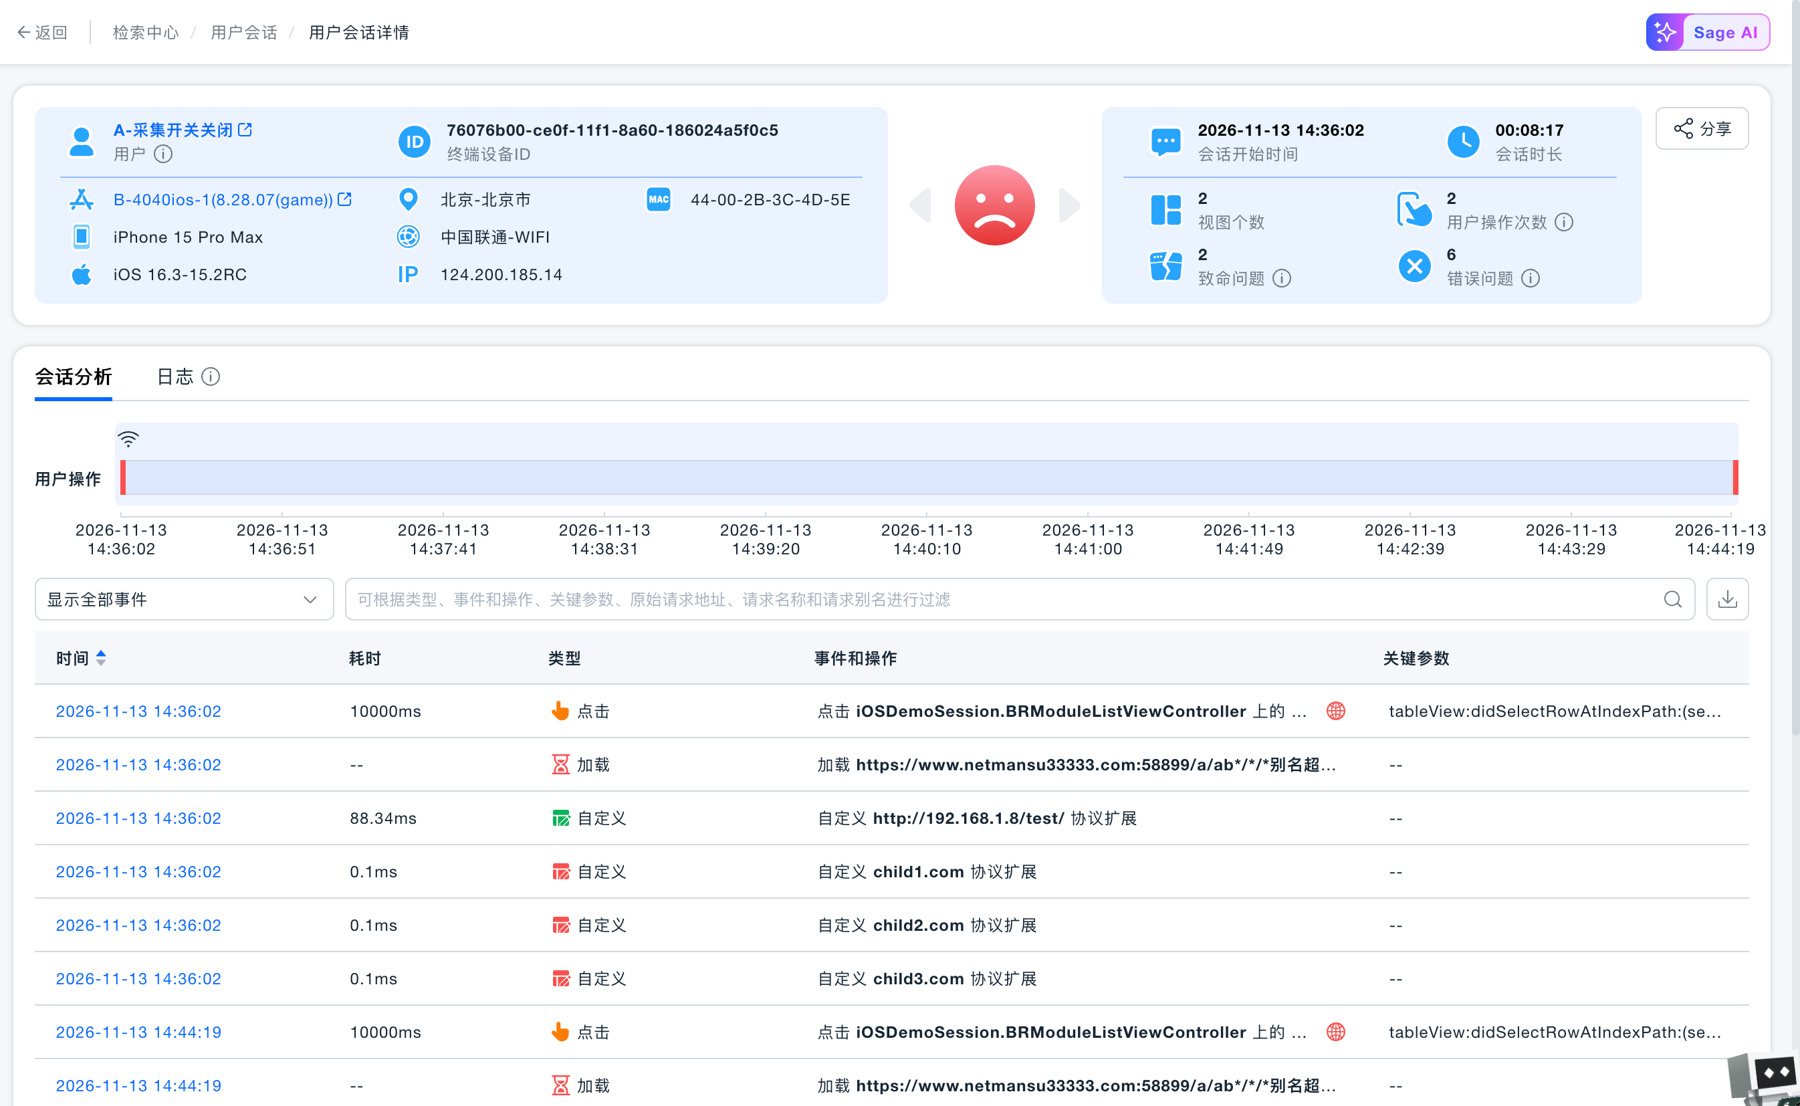
MAC Address Displayed in User Session Details
Resource System: Resource Management
New instance logs page. View the logs associated with an instance directly from its detail page. When investigating a metric anomaly, you can continue to check specific log records for the same object without leaving the instance page and searching for it again.
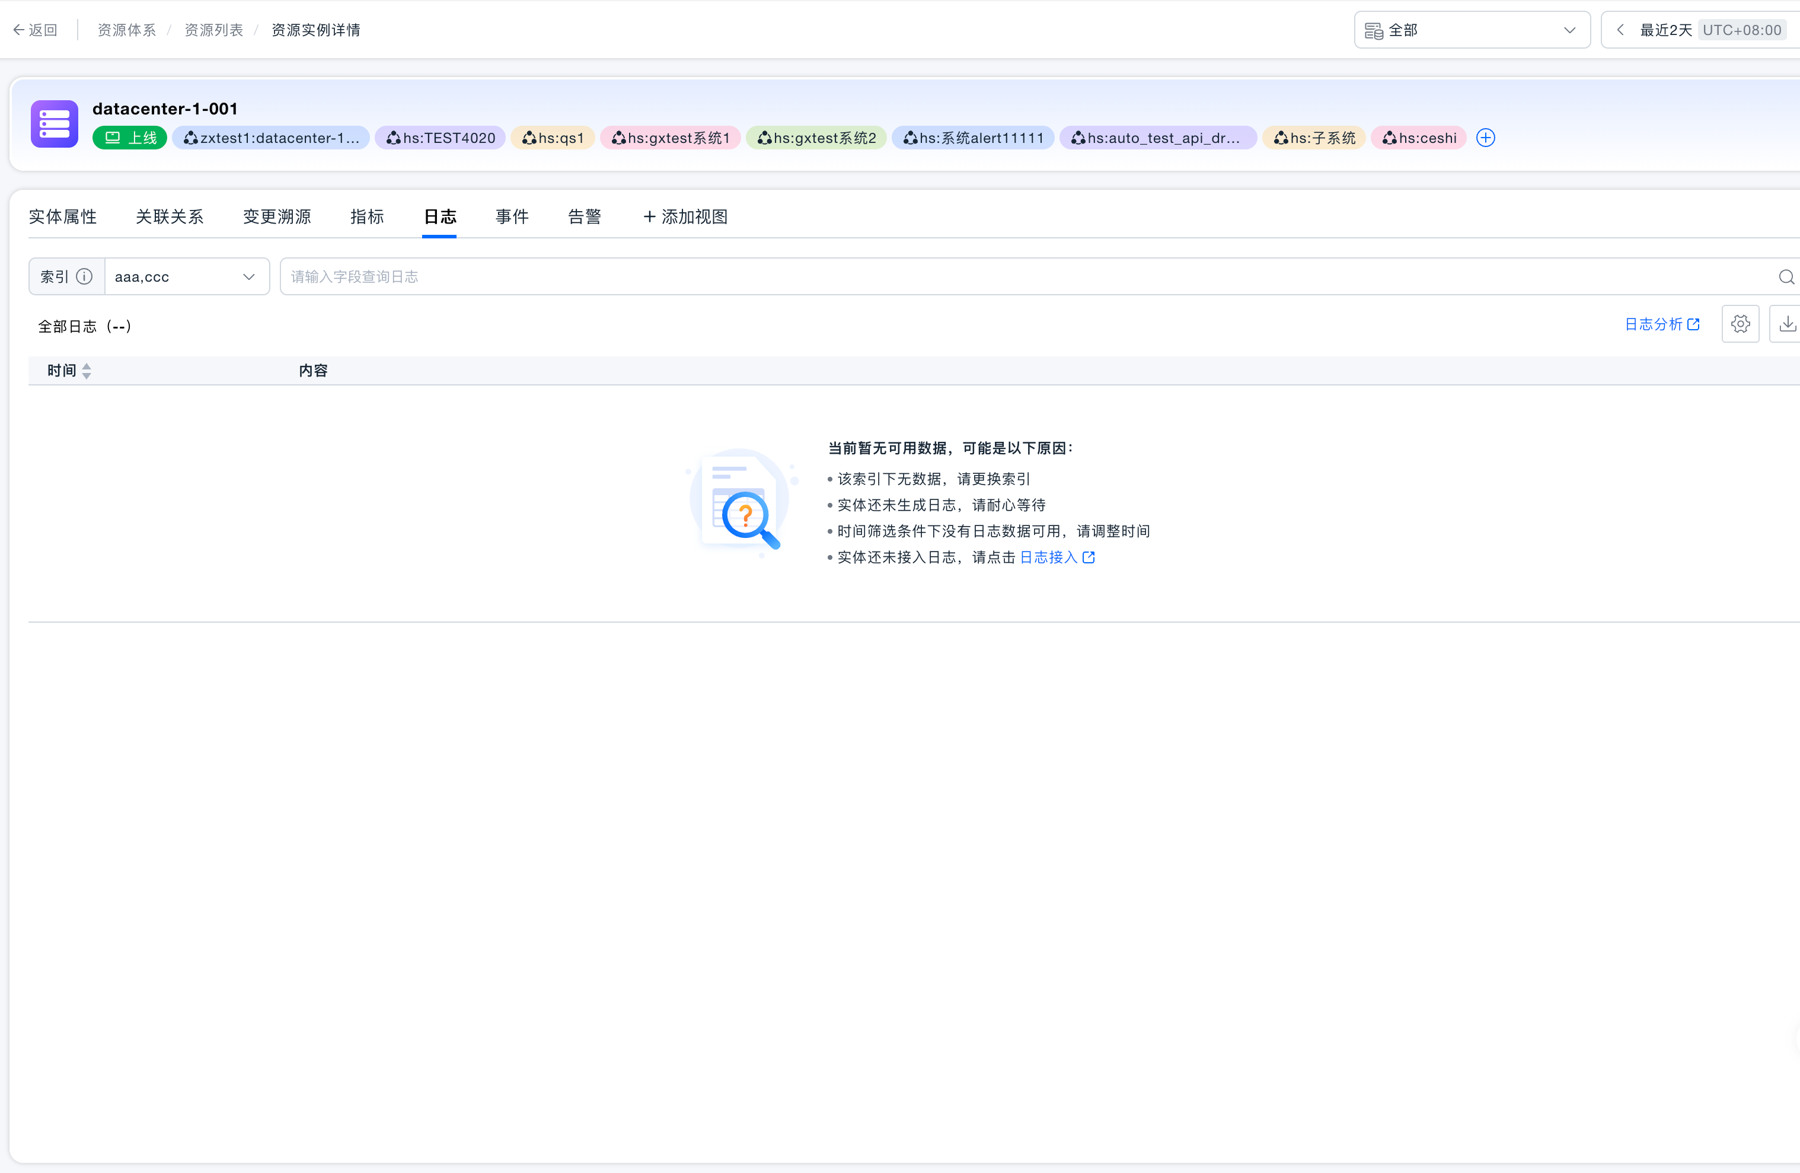
Logs Associated with a Resource Instance
New instance events page. View associated events from the instance detail page to understand status changes and anomaly records. Comparing events against metric changes helps verify when an anomaly occurred and what changed before and after.
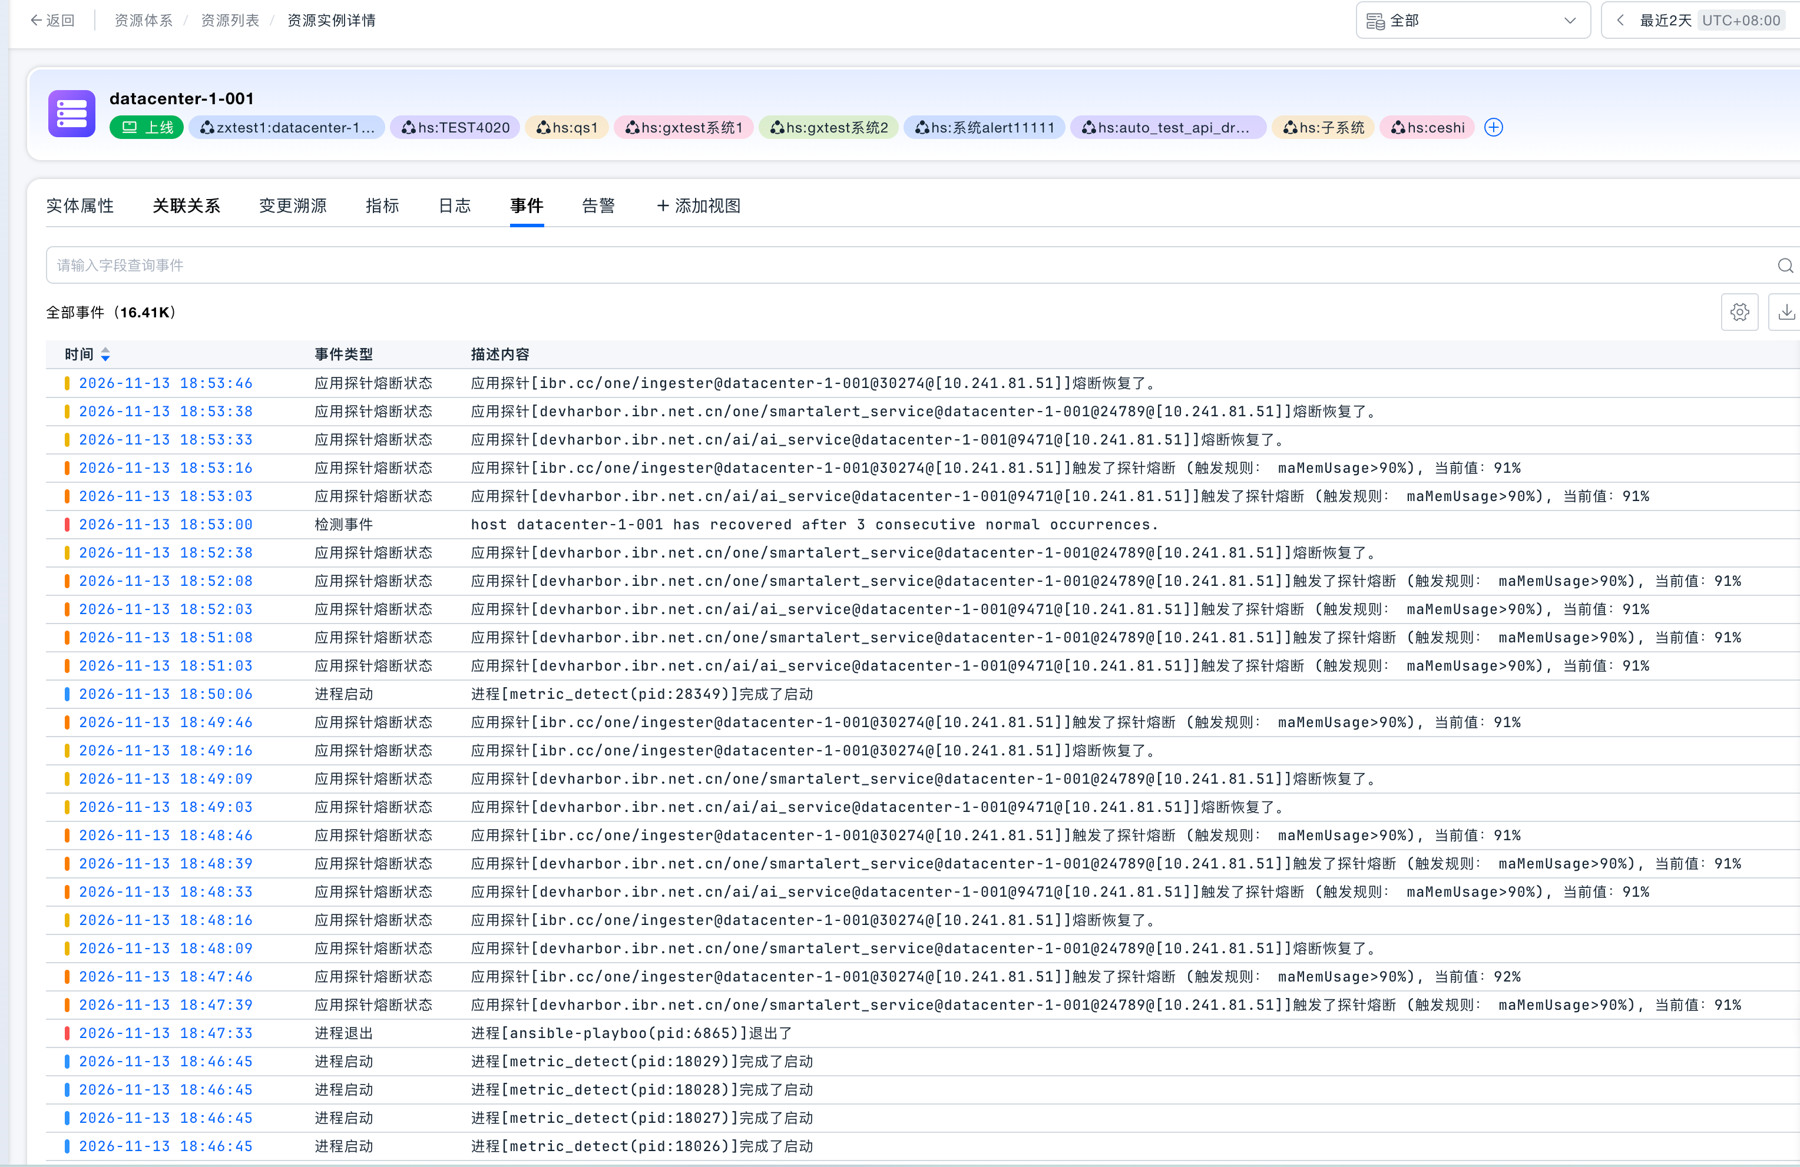
Events Associated with a Resource Instance
New instance alerts page. View associated alerts from the instance detail page to see how alerts have been triggered. Logs, events, alerts, and existing metric analysis together form the instance observability entry point, so teams can check operating signals and anomaly records around the same resource.
Alerts Associated with a Resource Instance
SmartAlert (Intelligent Alerting)
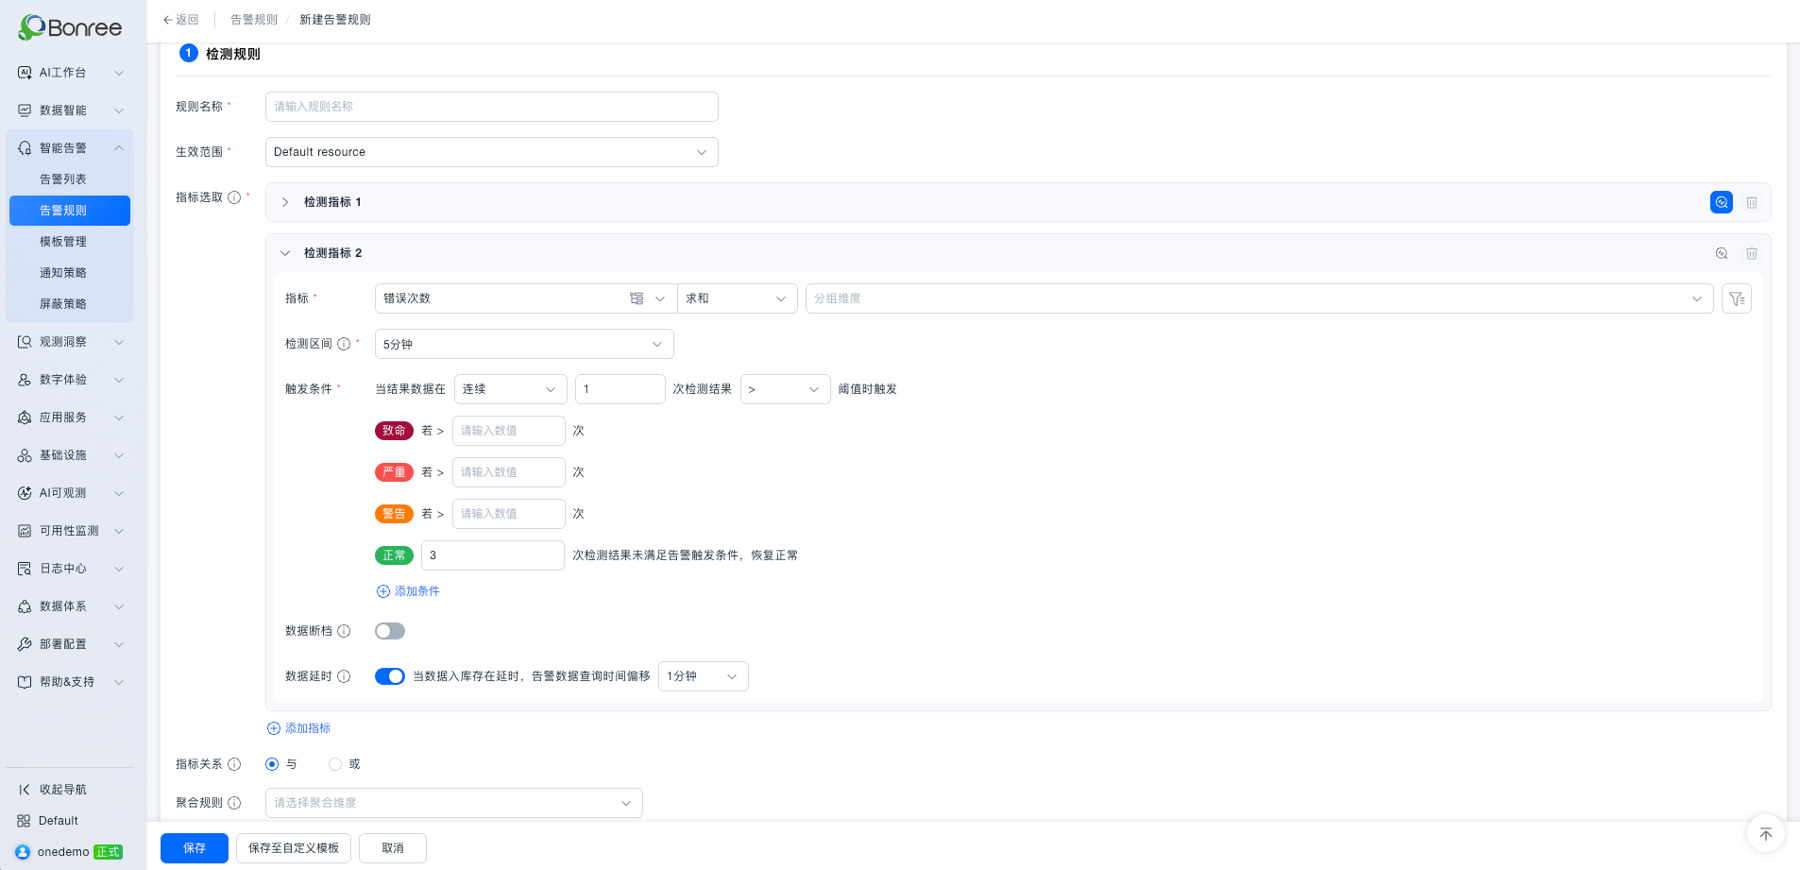
New multi-metric detection. Multiple metrics of the same object can jointly trigger an alert using “AND / OR” logic, and historical multi-metric rules can be migrated. Conditions that require a combined judgment can be placed in a single rule, making it easy to express detection requirements such as “all signals abnormal together” or “any signal abnormal.”
Multi-Metric Joint Detection Rule
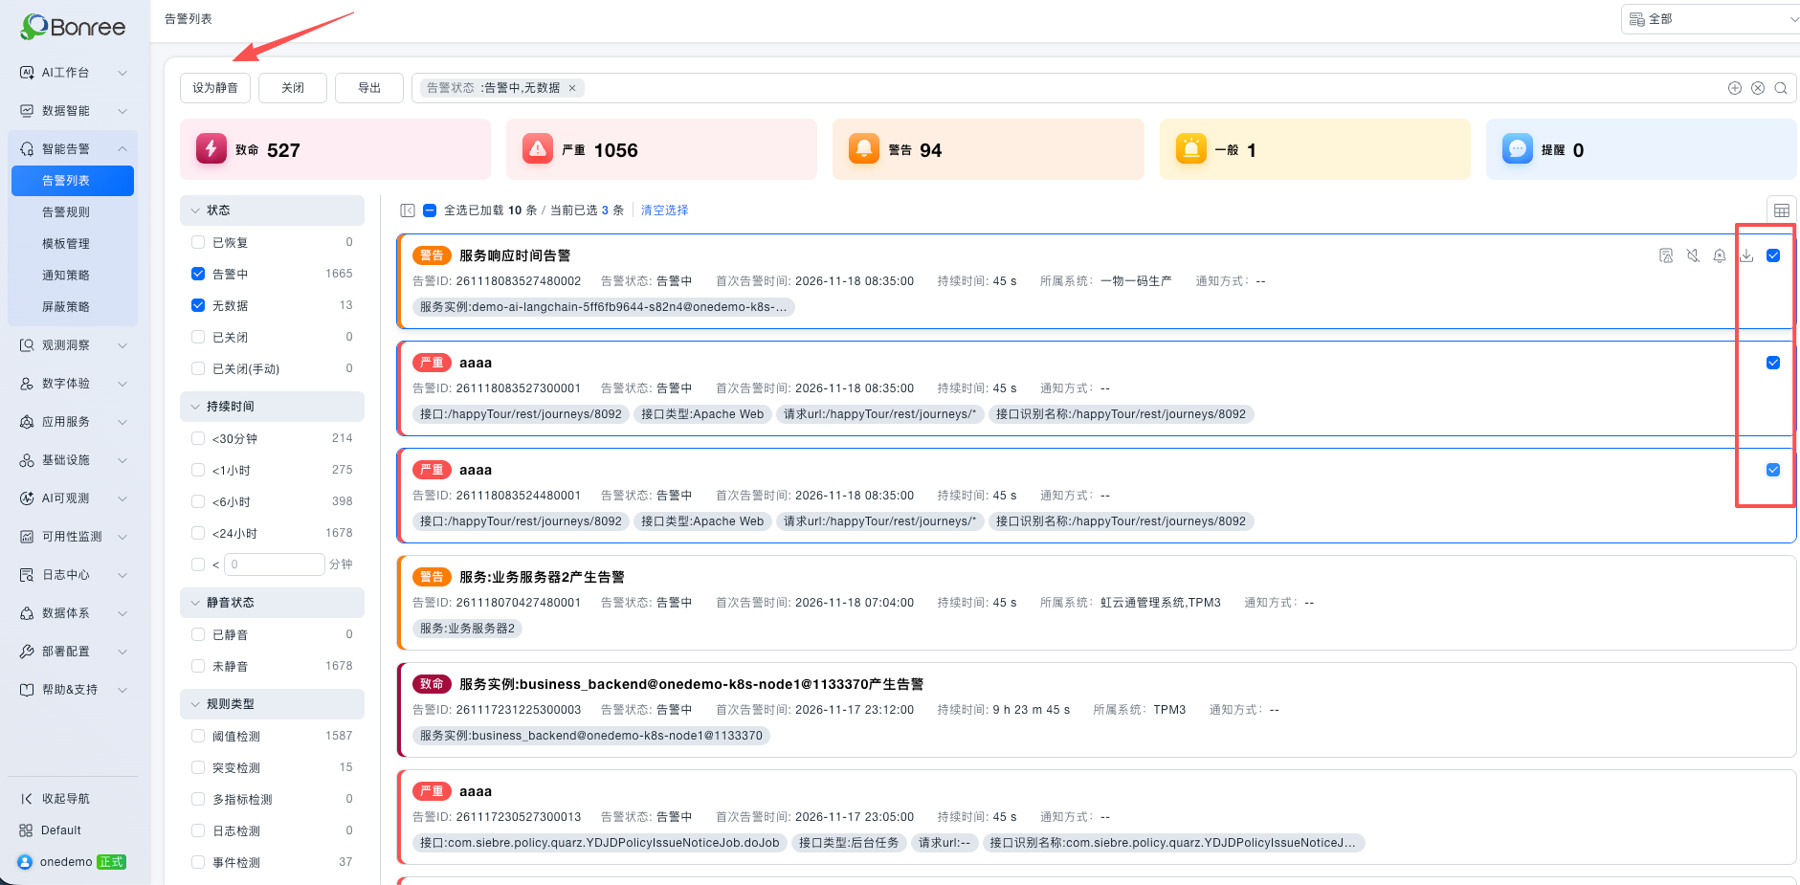
Bulk muting of alerts. Select multiple alerts and mute them in one action. When similar alerts need to be handled together, this reduces one-by-one operations and lets on-call staff manage notifications by handling scope.
Bulk Mute in the Alert List
Event detection grouped by associated entity. Event detection rules can be grouped by associated entity, and notifications can carry associated entity variables. Recipients can identify the objects that need checking faster, without searching for the resource again after receiving an alert.
Improved notifications and OpenAPI integration. Webhook time variables can be output in a specified format and time zone, and a new alert duration variable has been added. The alert list OpenAPI supports querying by primary entity and now includes the owning system and owning application fields. External systems can retrieve alerts by object and business ownership, reducing the effort of filling in missing information during integration.
Analysis (Data Analysis)
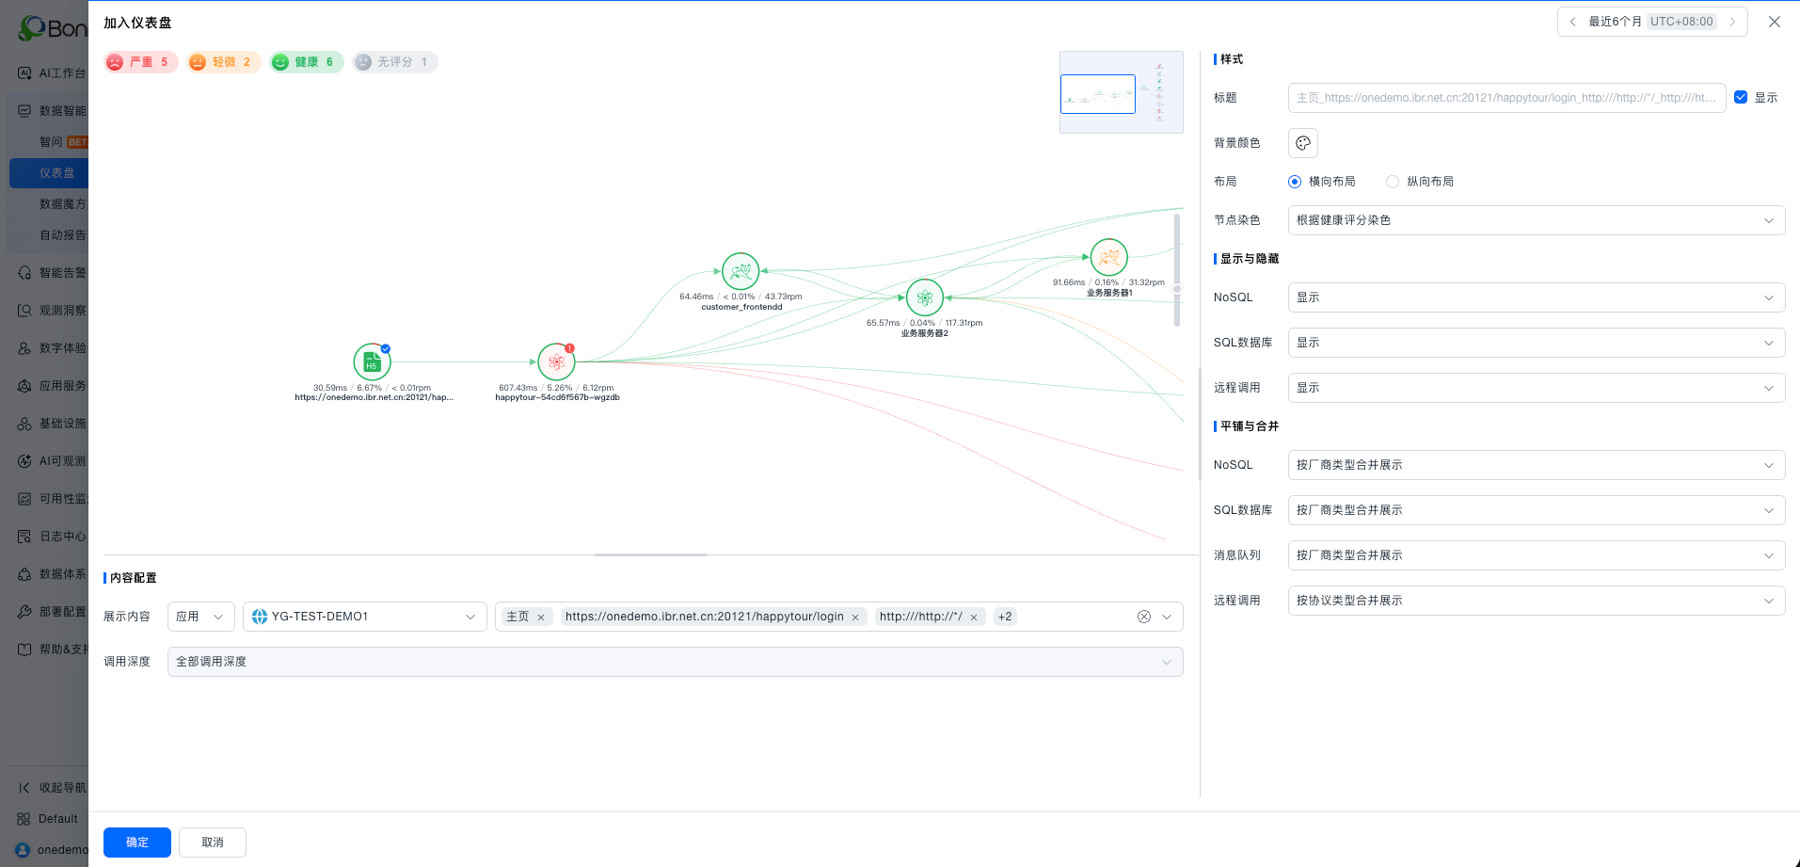
Select applications and pages in global topology cards. Choose the applications and pages you want to focus on directly in the global topology card, with the same selection experience as APM. The chosen scope carries into the dashboard, making it easy to show the call relationships of specified applications in one place.
Global Topology Card Configuration
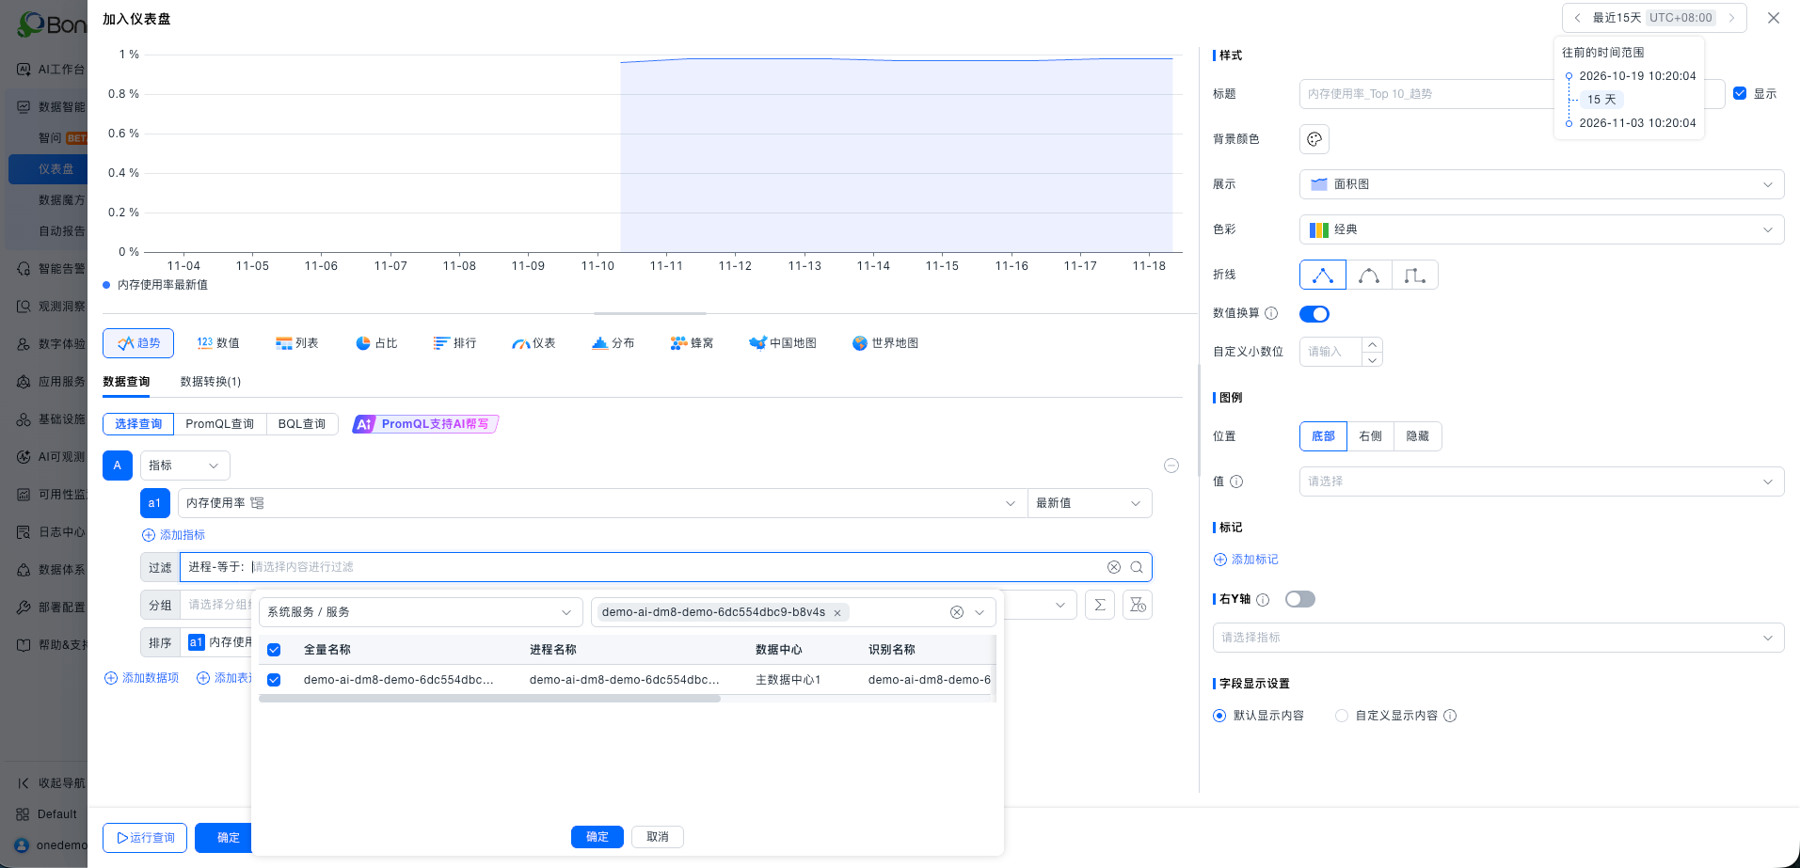
Cascading relationship filters for entity queries. Entities can be grouped by tag key, and the entity scope can be limited through Resource System relationship queries. You can first select a business object and then filter the resources to analyze along relationships, reducing the work of maintaining entity filter conditions one by one.
Limiting Entity Query Scope Through Resource System Relationships
Effective scope for view components. Components can be configured to apply to this instance, globally, or to a partial scope. Display can be controlled by the actual objects in use, balancing general configuration with instance-specific differences when reusing views.
LOG (Log Analysis)
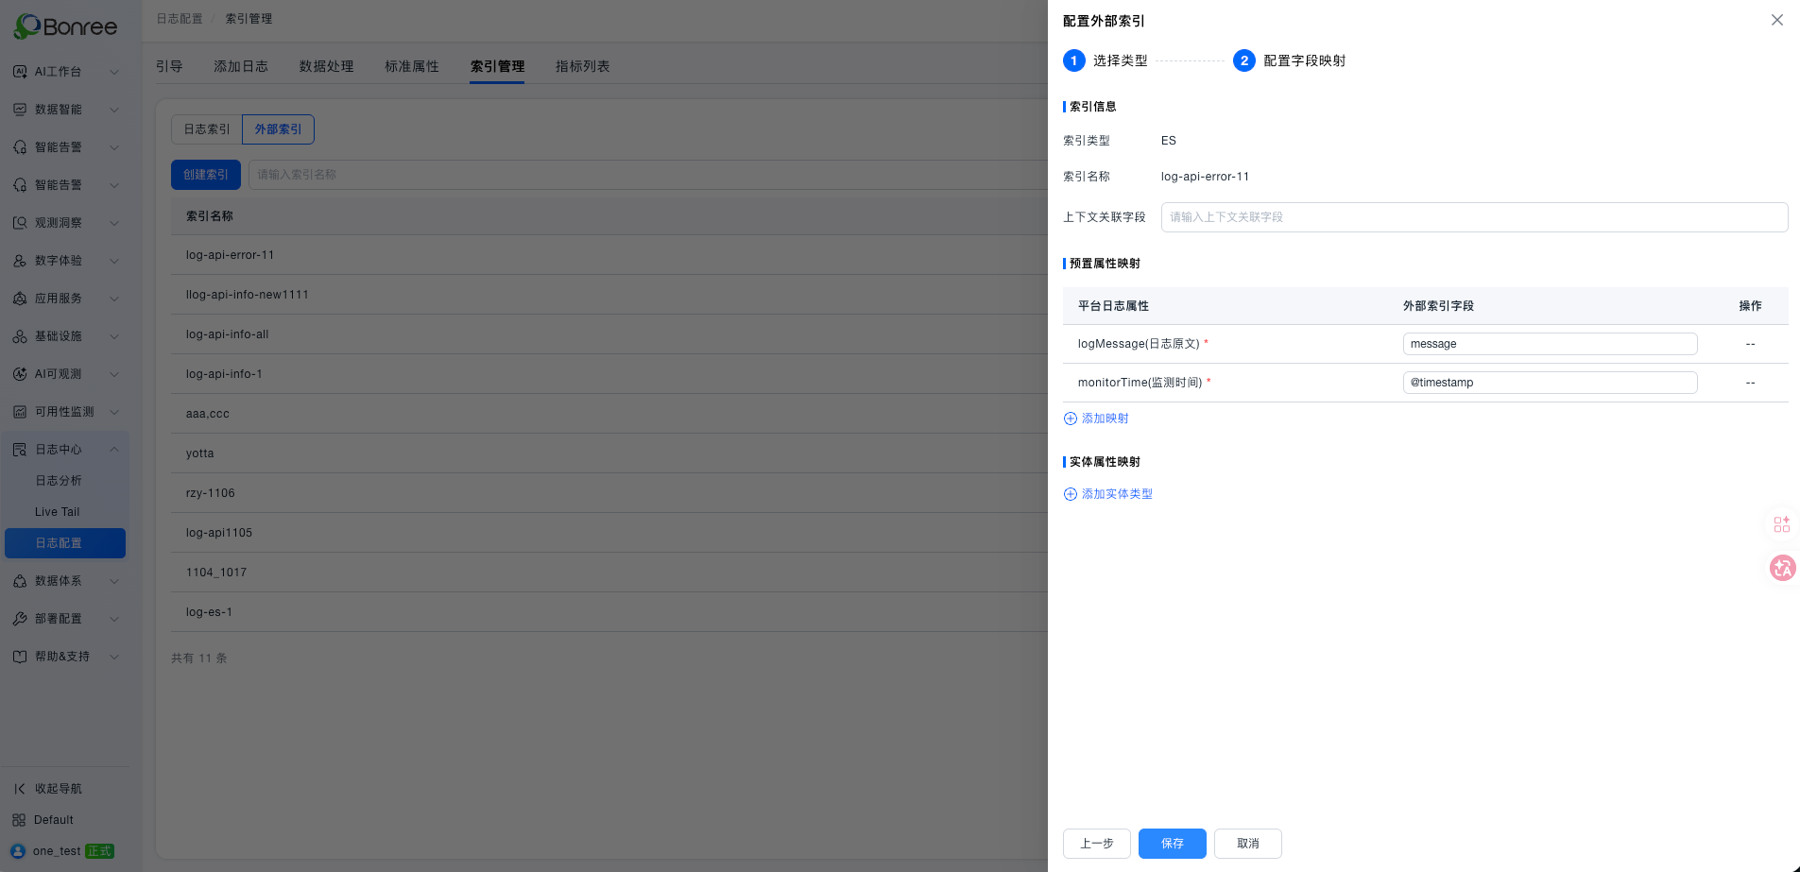
Query external ES or Rizhiyi indexes. After an external index is configured, platform log attributes and entity attributes can be mapped to it, so logs in the external index can be queried within the platform. Existing log resources enter a unified query entry point, reducing the need to switch log tools and re-locate objects during troubleshooting.
ETL (Data Integration)
New data integration assistant. Describe your integration goal in conversation, and the assistant finds matching integrations, explains the collection scope and configuration requirements, and helps configure the data center, tasks, and collection components and create tasks. After a task is created, you can also query its status, modify or delete it, and adjust data flows. This connects integration plan lookup, task configuration, and ongoing management, reducing the effort of hunting for entry points across multiple configuration pages.
Licensing and Upgrade Notes
Monthly AI Workbench quota. On the public cloud, credits are issued monthly; on private deployments, task quotas are issued monthly. Unused amounts are reset the following month and do not roll over. Once the monthly quota is used up, new conversations cannot be started; once the annual license expires, the entire AI Workbench becomes unavailable. Before upgrading, check your team’s monthly quota and license validity period.
Licensing for AI Observability and system services. AI Observability is billed by the number of LLM calls per month, with each reported LLM span counted as one call. For system services, 1 HU is now counted per 8 GiB of memory per host, rounded up for any remainder below 8 GiB; the HU and HOST billing methods are mutually exclusive. This makes it easier to re-check licensing needs based on call volume and host scale.
For the full details of this update and upgrade considerations, see the Bonree ONE 4.0.4.0 Release Notes.