



Recap of Session 1 | Observability in Practice for Southeast Asia’s Financial Sector: AI Agent End-to-End Observability
As large language models mature, AI Agents are moving from proof of concept to real business use. In Southeast Asia, banks and other financial institutions are rapidly handing scenarios such as intelligent customer service and account and transaction inquiries over to Agents, and more and more business interactions now happen through conversation. Regulators are moving in step. In Singapore, for example, the Monetary Authority of Singapore (MAS) formally issued its Guidelines on Artificial Intelligence Risk Management this October. It requires financial institutions to take a full inventory of their AI applications and to put in place management controls covering testing, oversight, and continuous monitoring across the entire lifecycle. The deeper AI is embedded in the business, the more “clear visibility and firm control” becomes a question every financial institution must answer once AI goes into production.
A seemingly simple customer interaction can involve multiple conversation turns, model requests, and tool calls. Where does the latency come from? Which step is hiding the error? Where is token consumption concentrated? These are the questions that must be answered once an AI Agent is running in production. To address them, Bonree launched the first session of its Observability in Practice for Southeast Asia’s Financial Sector webinar series on November 11. Under the theme “AI Agents in Production: How to See Every Call Clearly,” Ding Wei, Technical Director at Bonree, used a simulated AI customer service Agent in a Southeast Asian banking scenario to demonstrate live how Bonree ONE reconstructs the full call chain of an Agent, from the application to the model to the tools, and pinpoints performance latency, call errors, and token consumption issues.
AI Observability: Making Every Agent Action Traceable
Ding Wei opened by explaining the core of AI observability: continuously collecting and correlating telemetry across the entire technology stack in pre-production, testing, and production environments, so teams have a complete picture of how Agents, large models, and their downstream services are running. For development teams, AI observability helps refine prompts and interaction flows. For operations teams, it strengthens service stability and performance assurance. For AI platform teams, it supports ongoing improvements in service efficiency and quality. The end goal is AI services that run stably, efficiently, and at a controlled cost.
The monitoring challenge after an Agent goes live is often called “black-box anxiety”: the application is deployed in a public or private cloud, yet it is hard to know exactly what is happening inside. To address this, Bonree ONE offers four core capabilities:
End-to-end call tracing: covers both large model and tool calls.
Multidimensional service observation: presents service performance through performance, token, model, and conversation data.
Multi-turn conversation reconstruction: links multiple interactions to restore the complete task from start to finish.
Anomaly drill-down: starts from latency, errors, or abnormal token usage and traces down layer by layer to the root cause.
In the hands-on demo, Ding Wei used concrete application scenarios to show each of these four capabilities in action.
The Big Picture: One View of AI Service Health
Troubleshooting starts with a full understanding of how AI services are running. Bonree ONE uses a service topology to show the call relationships between AI services and large models, MCP tools, databases, and third-party services, giving teams an intuitive view of service dependencies. The demo environment included three AI services built on LangGraph (Python), LangChain (Python), and Spring AI (Java).
The AI service list shows request volume, error count, average response time, and token usage for each service in one place. Drilling into a specific service, teams can analyze its behavior along three dimensions: performance, tokens, and models. The performance view surfaces response latency and errors. The token view shows consumption trends and helps estimate call costs. The model view compares call volume, token usage, and response performance across different models.
Bonree ONE also reports response time separately for the AI service layer and the model layer, helping teams tell whether latency comes from the Agent application itself or from the large model call. Combined with Agent runtime logs and container and Kubernetes events, teams can dig further into abnormal service behavior.
From overall service status to model performance to upstream and downstream dependencies, teams can spot anomalies faster and know where to look next.
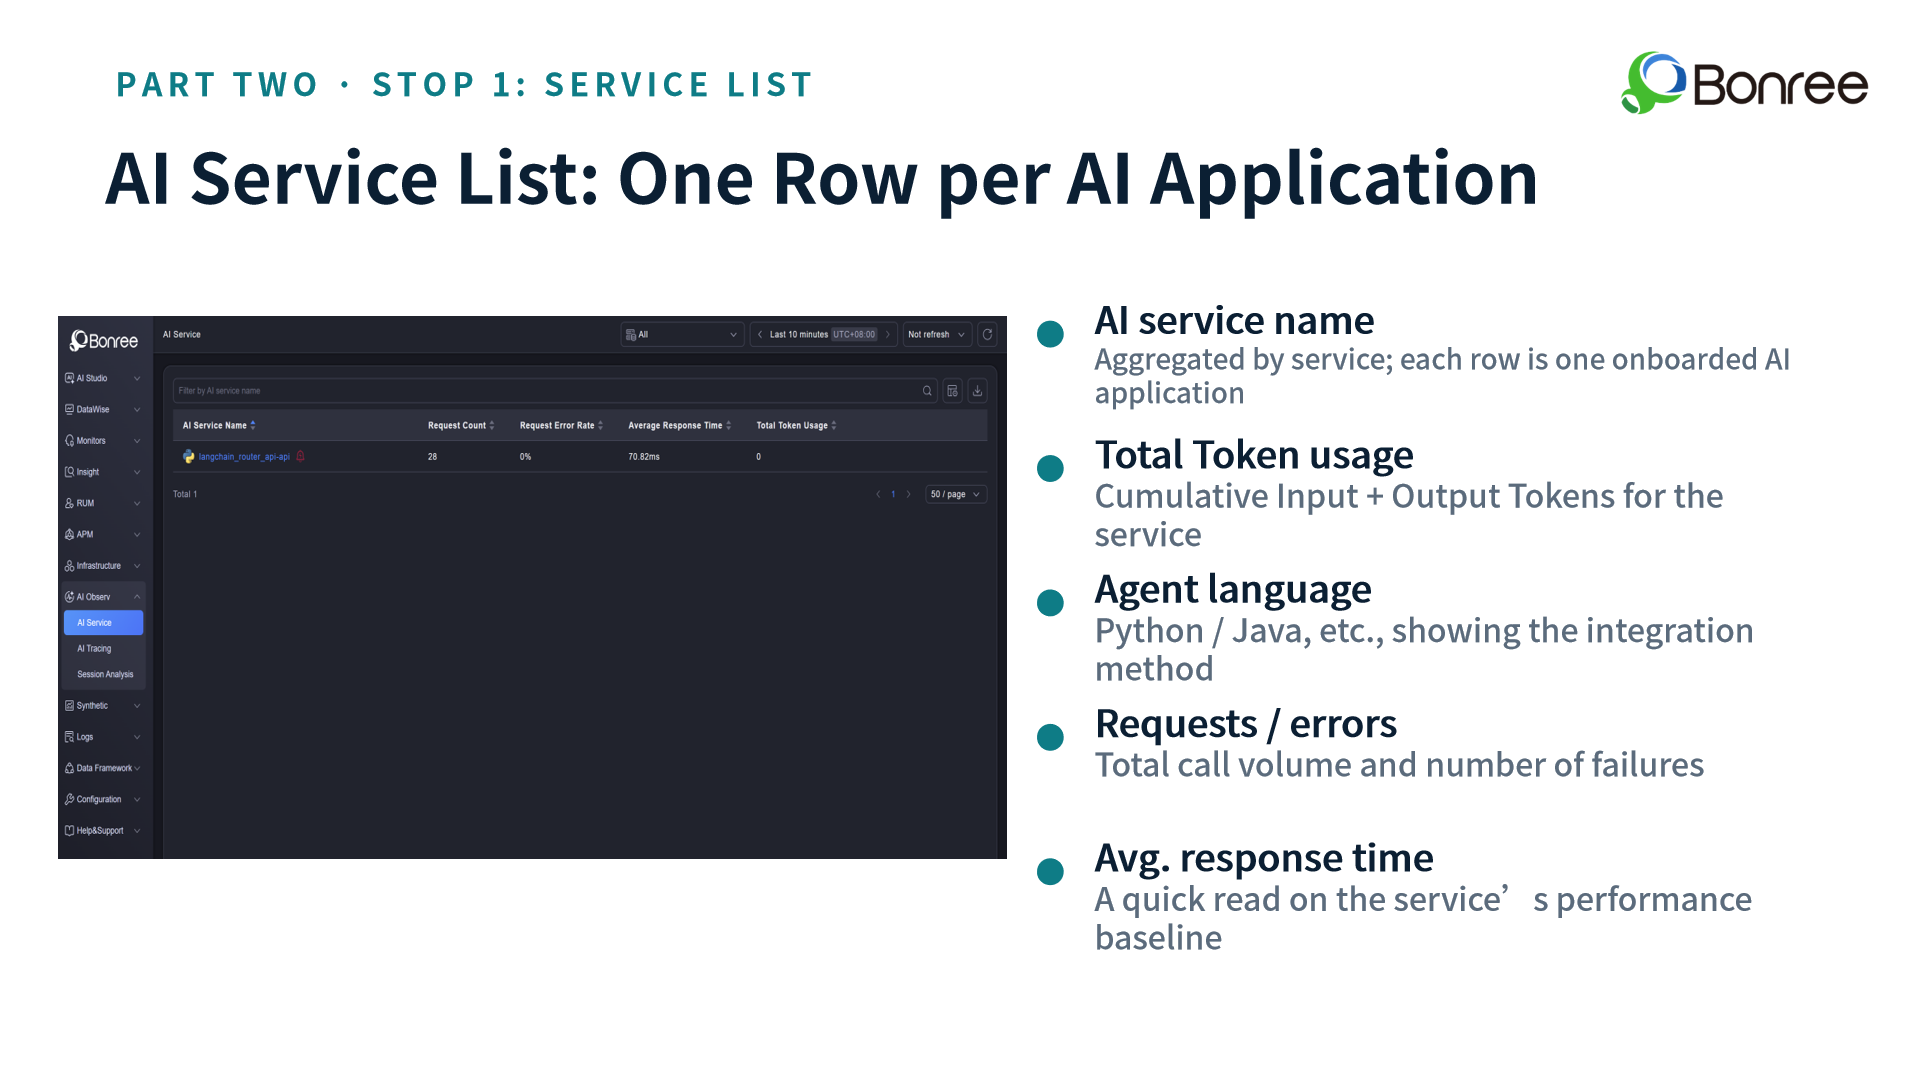
[Service topology and AI service list]
Following the Trail: From a Slow Request to the Root Cause
Once an anomaly is spotted, the next step is to find out which stage it occurred in. Bonree ONE uses Traces and Spans to reconstruct the full execution of an AI interaction. A Trace represents one complete call, and Spans record each execution step within it, including Agent, LLM, tool calls, vector retrieval, workflows, and MCP.
In the trace details, teams can see the execution order, duration, and input and output of each step. For LLM call nodes, they can also view the model name, input and output messages, token usage, and call duration, along with inference parameters such as Temperature and Top-p, which provide a basis for analyzing model behavior and locating anomalies.
The live demo began with the LangChain service. Ding Wei picked a slow request and followed the call chain layer by layer through the Agent’s execution and the information at each step, then drilled into the LLM call node to examine the request details.
The demo then switched to the Java-based Spring AI service to show cross-language, cross-service tracing. From the user request entering the Java application, to the call to the large model and third-party services, and on to another Python service, the calls between different technology stacks are stitched together in one view. This helps teams identify exactly where a problem occurred and where the time went.
Whether the issue is a single model call anomaly or a complex cross-language, cross-service call problem, teams can trace it down the entire chain and narrow the scope of investigation.
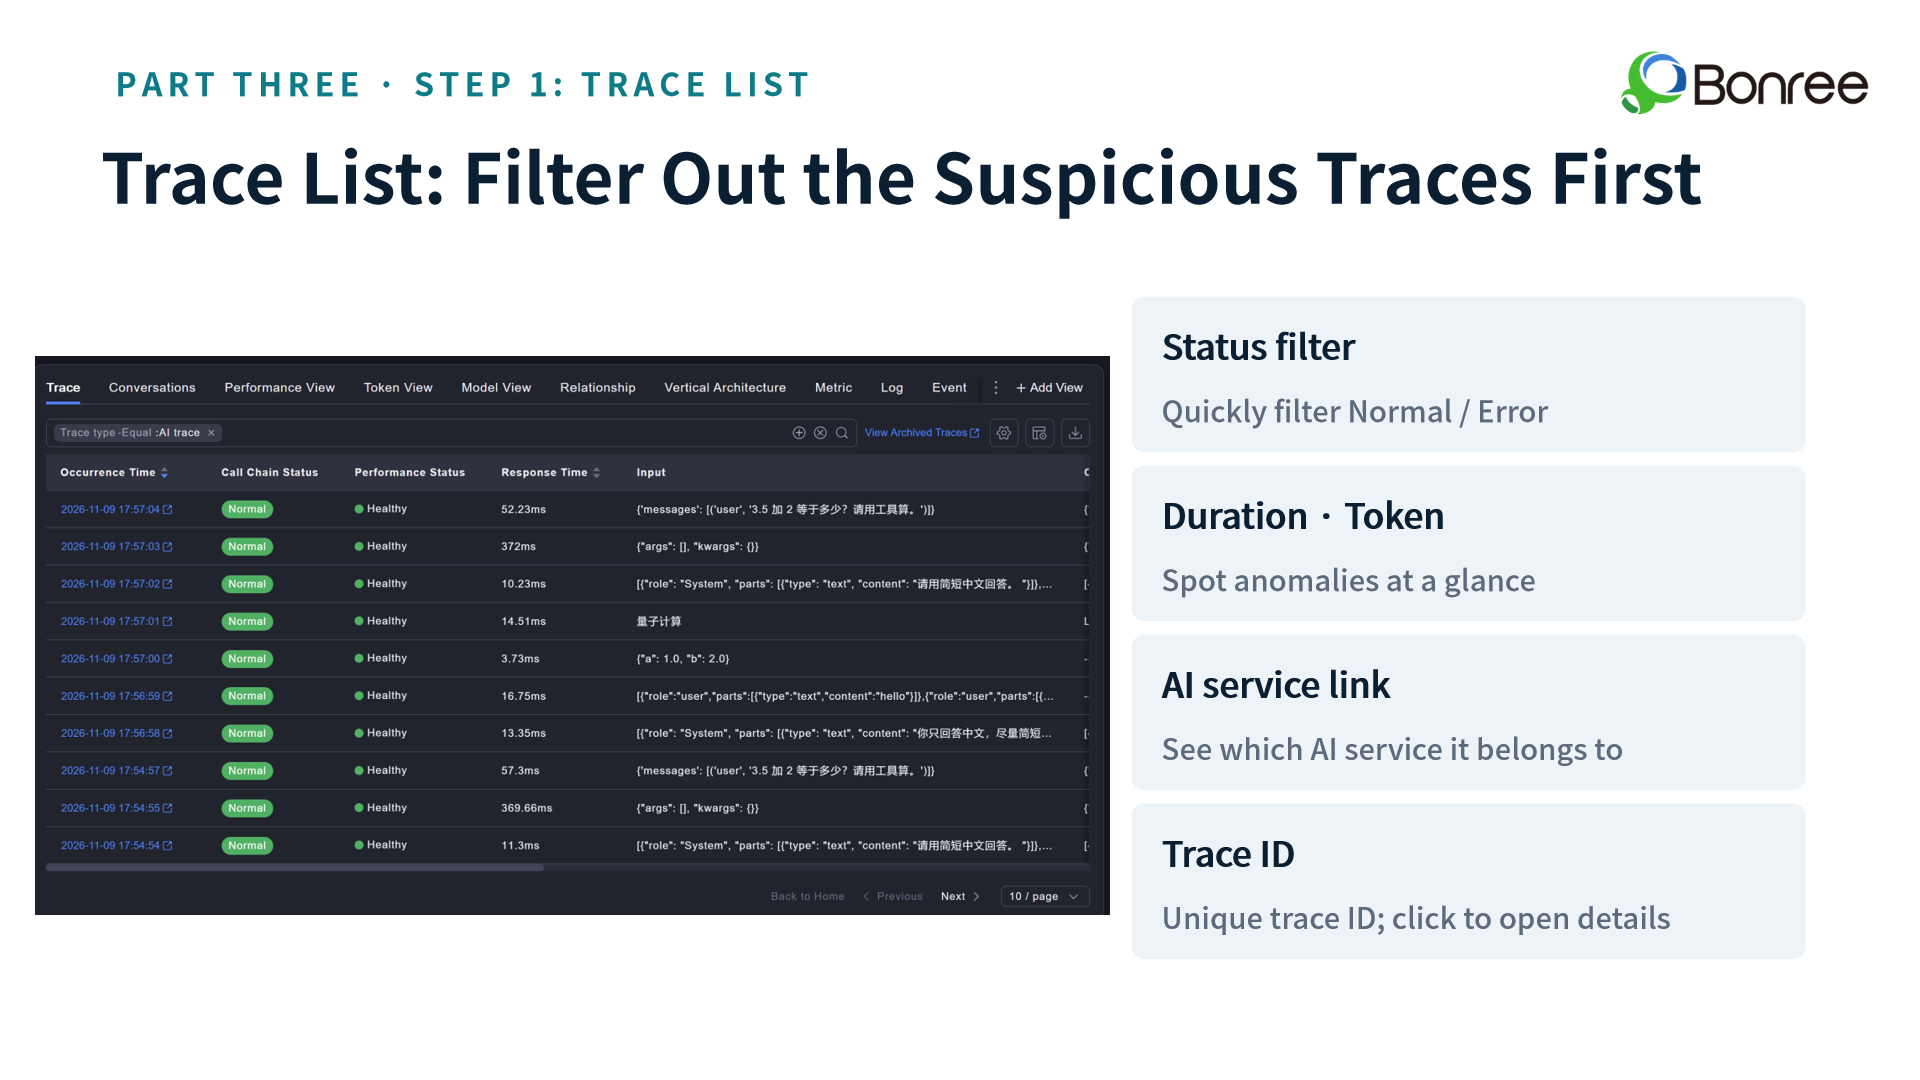
[Trace details and call relationship diagram]
Recreating the Scene: Analyzing Multi-Turn Conversations as a Whole
For an AI Agent, a single user task often spans multiple turns of interaction. Looking at one call chain at a time makes it hard to fully reconstruct the user’s request and how the Agent responded.
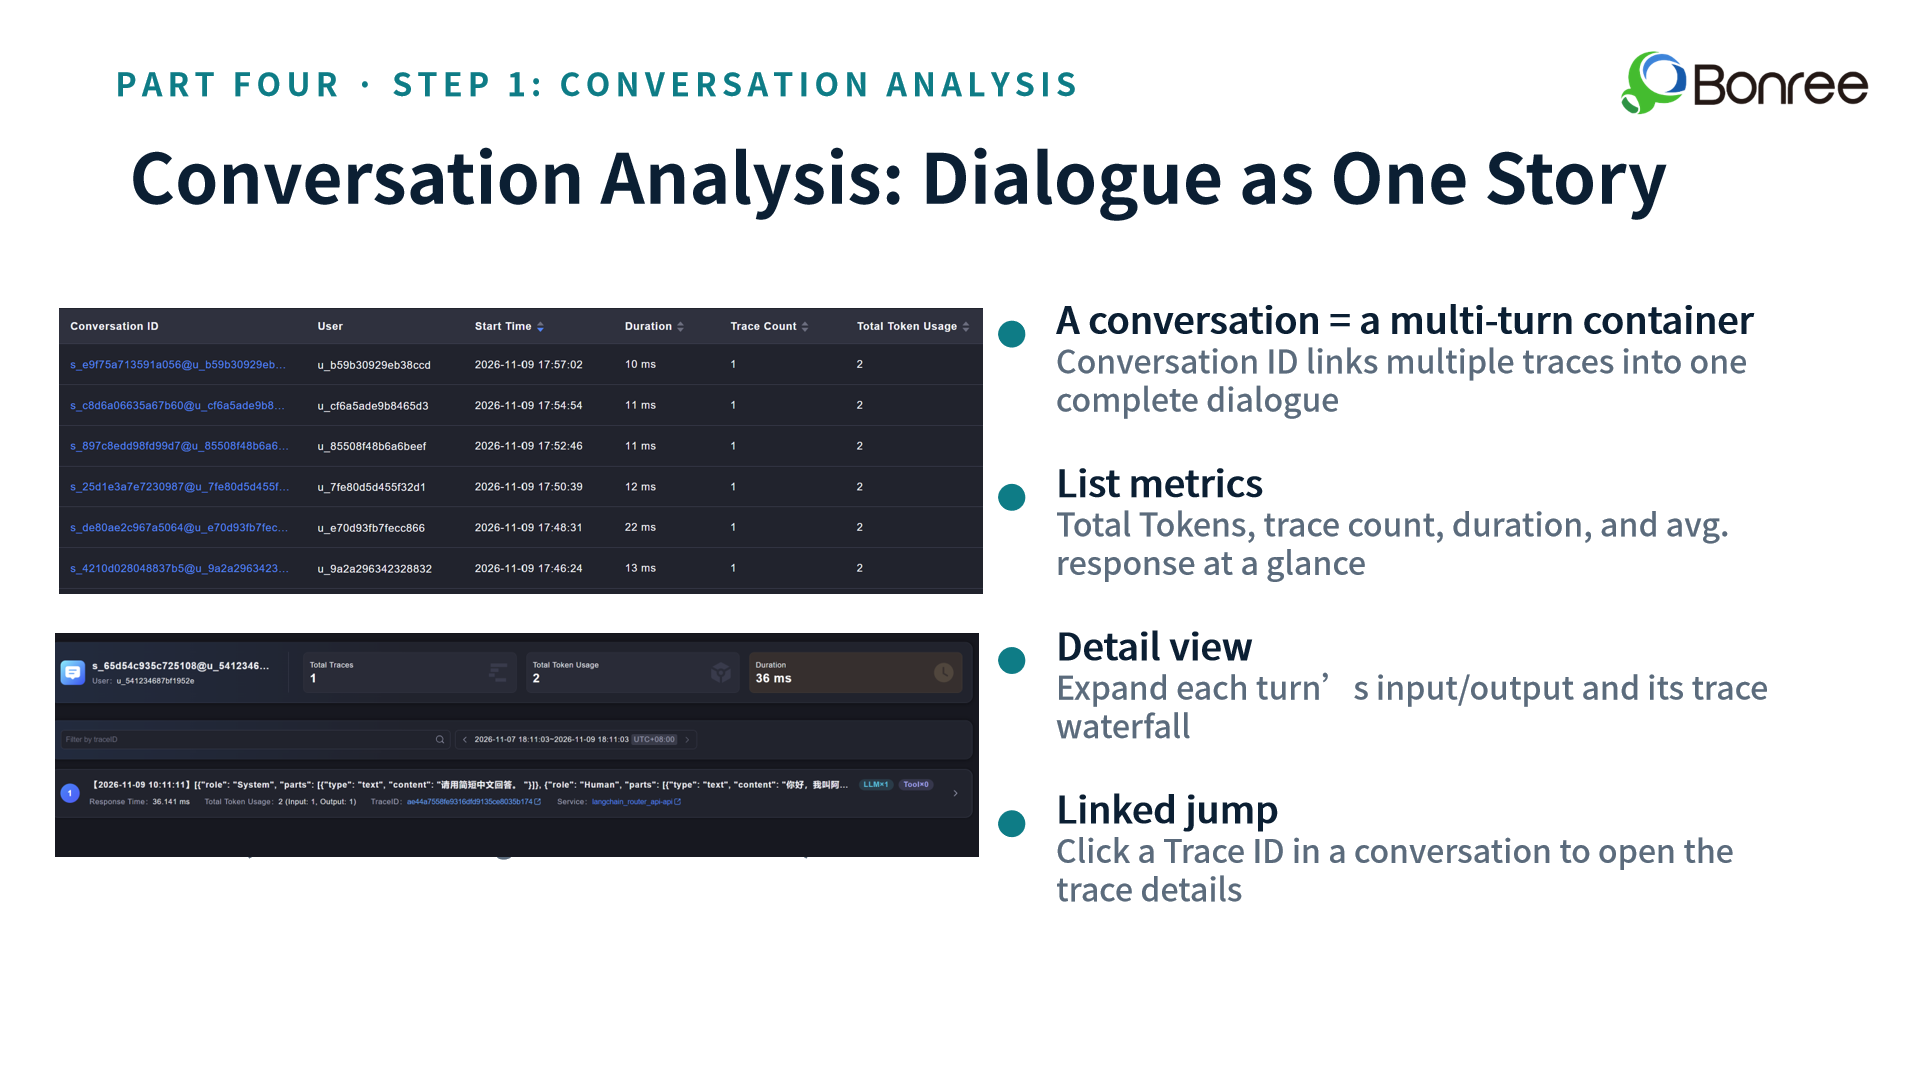
To solve this, Bonree ONE uses a conversation ID to link multiple traces within the same context and assemble a multi-turn interaction into a complete Conversation. Teams can view the conversation’s duration, number of traces, and total token count, step through each turn’s user question, Agent reply, and corresponding trace waterfall chart, and jump directly to the specific call details via the Trace ID.
When a user reports “it just gave me the wrong answer,” technical teams can use conversation analysis to quickly locate the session, replay the full interaction, and then trace the specific call in question, without asking the user to repeat the steps or reproduce the issue.
Extending from single-call tracing to full conversation reconstruction, teams can see not only every step of execution but also how an AI task ran as a whole.
[Conversation analysis]
From Demo to Deployment
On the practical side of adoption, the session also walked through the onboarding process for AI services in five steps: choosing an integration method, deploying the intelligent agent, restarting the service, validating the data, and starting observation. Ding Wei also recommended that teams build the following into daily operations to maintain continuous visibility into how their AI services are running:
Performance and error monitoring
Token consumption and cost management
User feedback tracking
Alerting on key metrics
Get the presentation materials: https://host.huiju.cool/p/1f4444