With the continuous expansion of various unified business systems under China Railway Cloud Network Information Technology Co., Ltd. (hereinafter “China Railway Information Technology”), system interdependencies and deployment environments have become increasingly complex, raising higher requirements for application performance monitoring and operations management.
At the same time, system stability and response speed directly affect business efficiency and user satisfaction, making efficient and precise monitoring capabilities critical to ensuring business continuity.
Currently, China Railway Information Technology faces the following challenges in application performance management:
Difficult performance bottleneck localization
Existing tools lack fine-grained monitoring across frontend, backend services, databases, and middleware, making it impossible to capture key metrics such as API response time, throughput, error rate, and slow SQL, which leads to difficulty in accurately identifying performance bottlenecks.
Delayed anomaly detection and response
There is a lack of automated anomaly detection and alerting mechanisms. Issues are often discovered manually, and notifications are not timely, making it difficult for development and operations teams to respond immediately.
Low root cause analysis efficiency
Due to insufficient transaction tracing capabilities, it is not possible to trace issues along the full call chain, resulting in long troubleshooting and recovery time.
These challenges significantly increase operational pressure under high concurrency and complex service scenarios, creating an urgent need for a comprehensive application monitoring and diagnostic system.
Full-stack multi-language application performance monitoring and visualization
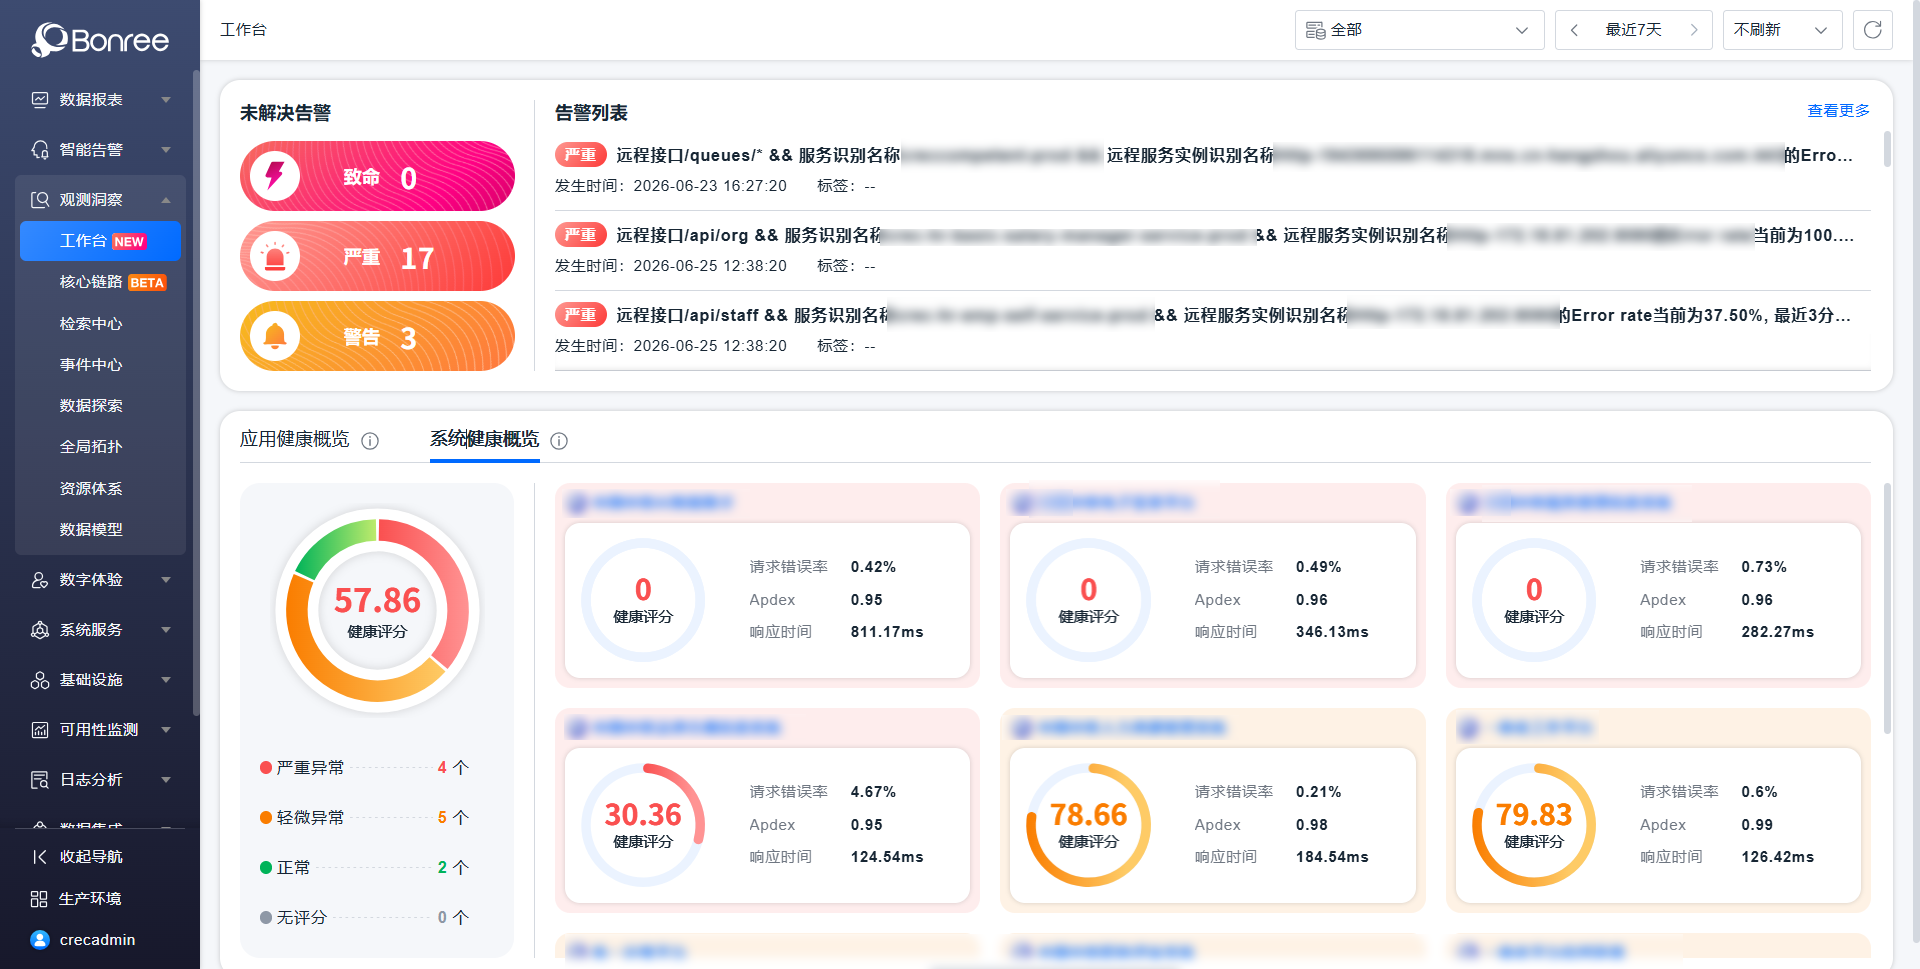
Based on the Bonree ONE platform, agents can be deployed across Java, Python, Go, .NET, and Node.js applications. The system automatically collects performance metrics such as CPU, memory, disk I/O, network traffic, request latency, and error rates.
Through intuitive dashboards, the platform provides real-time visualization of application, system, and host-level data, enabling multidimensional filtering and comparison for full visibility of system health.
End-to-end user experience analysis and full tracing
The platform supports session analysis, anomaly detection, and user behavior profiling. It automatically detects frontend anomalies and provides logs and inferred root causes.
It also enables bidirectional end-to-end tracing between frontend and backend services, including distributed call chain tracing, automatic topology discovery, and breakdown of latency across databases, NoSQL, and message queues.
Infrastructure and middleware monitoring
The platform provides unified monitoring of hosts (CPU, memory, disk, network), Kubernetes clusters, containers, processes, and mainstream databases and middleware such as MySQL, MariaDB, Oracle, MongoDB, Redis, and Kafka.
This ensures comprehensive observability from applications down to infrastructure.
Support for domestic (Xinchuang) environments
Bonree ONE supports domestic ecosystem compatibility, including middleware (e.g., TongTech, BOSH), databases (e.g., Dameng, Kingbase), operating systems (Kylin, UOS), and hardware architectures (Kunpeng, Phytium).
This ensures stable deployment in localized infrastructure environments.
Intelligent diagnostics, alerting, and continuous assurance
The platform provides advanced diagnostics such as thread profiling and memory dump analysis, along with detailed error logging.
It supports configurable monitoring metrics and alert thresholds, enabling automatic anomaly detection with multi-channel notifications (email, SMS, and in-platform messaging).
Improved system observability: Full end-to-end monitoring from user experience to distributed tracing and performance trend analysis, forming a complete observability loop.
Enhanced stability and user satisfaction: Deep performance monitoring across multi-language applications and frontend/backend systems improves responsiveness and reliability.
Higher troubleshooting efficiency: Root cause analysis, database performance insights, and advanced diagnostics significantly reduce MTTR (mean time to resolution).
Support for localized infrastructure: Full compatibility with domestic software, OS, and hardware ensures stable operation in Xinchuang environments.
Data-driven operations: Regular performance and anomaly reports support operational decision-making and system evolution.
Strong technical capability
Member of the AIOps Standard Working Group of the China Academy of Information and Communications Technology (CAICT), and ranked No.1 in China’s APM and observability (APMO) market share.
Market advantages
Full-featured capabilities, high performance, flexible deployment options, efficient technical support system, and cost advantages.