





Release date: October 31, 2026
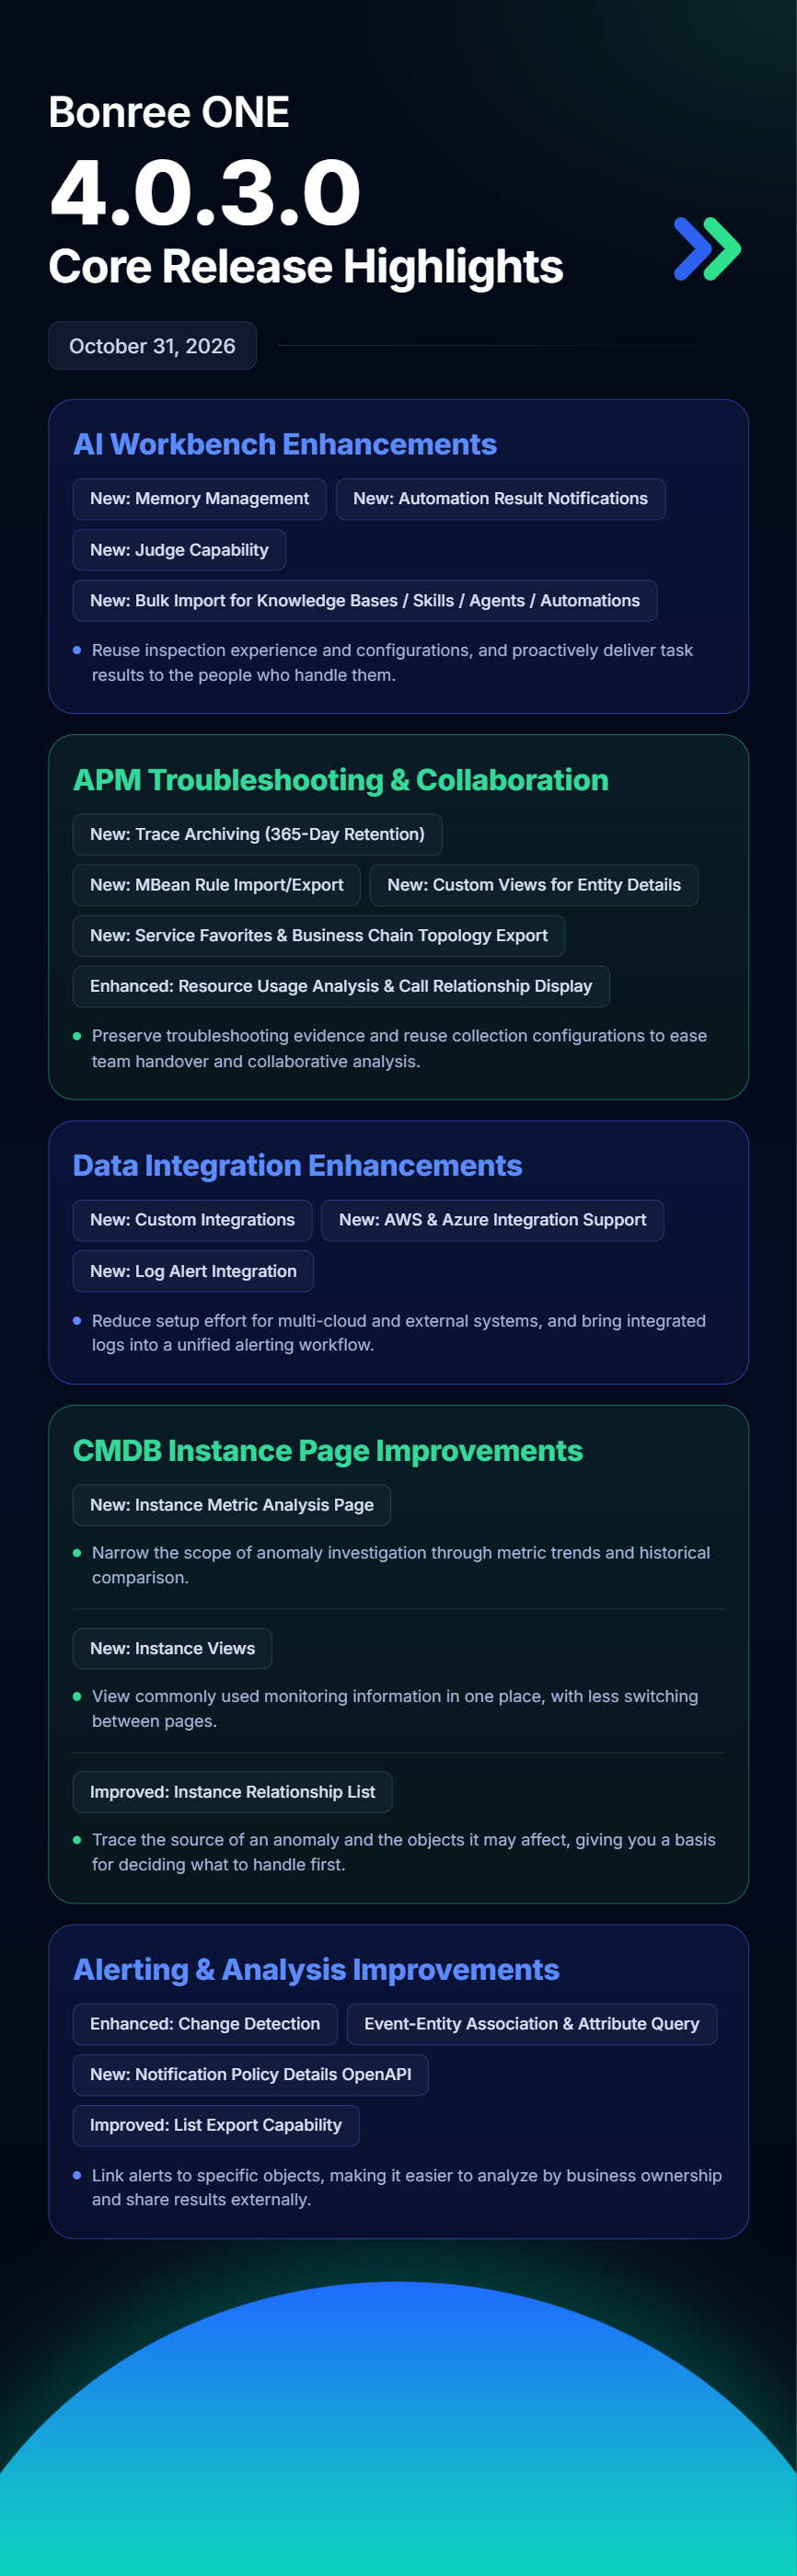
Bonree ONE 4.0.3.0 is now available. This release centers on updates to the AI Workbench, APM troubleshooting and collaboration, data integration, CMDB instance pages, and alerting and analytics.
What’s New
AI Workbench
Memory management. Once you configure an embedding model and turn on memory, Sage AI can draw on verified execution experience in later tasks to help choose the right agents, Skills, and tools. Troubleshooting approaches that have already proven effective can be reused, which cuts down on repeated exploration.
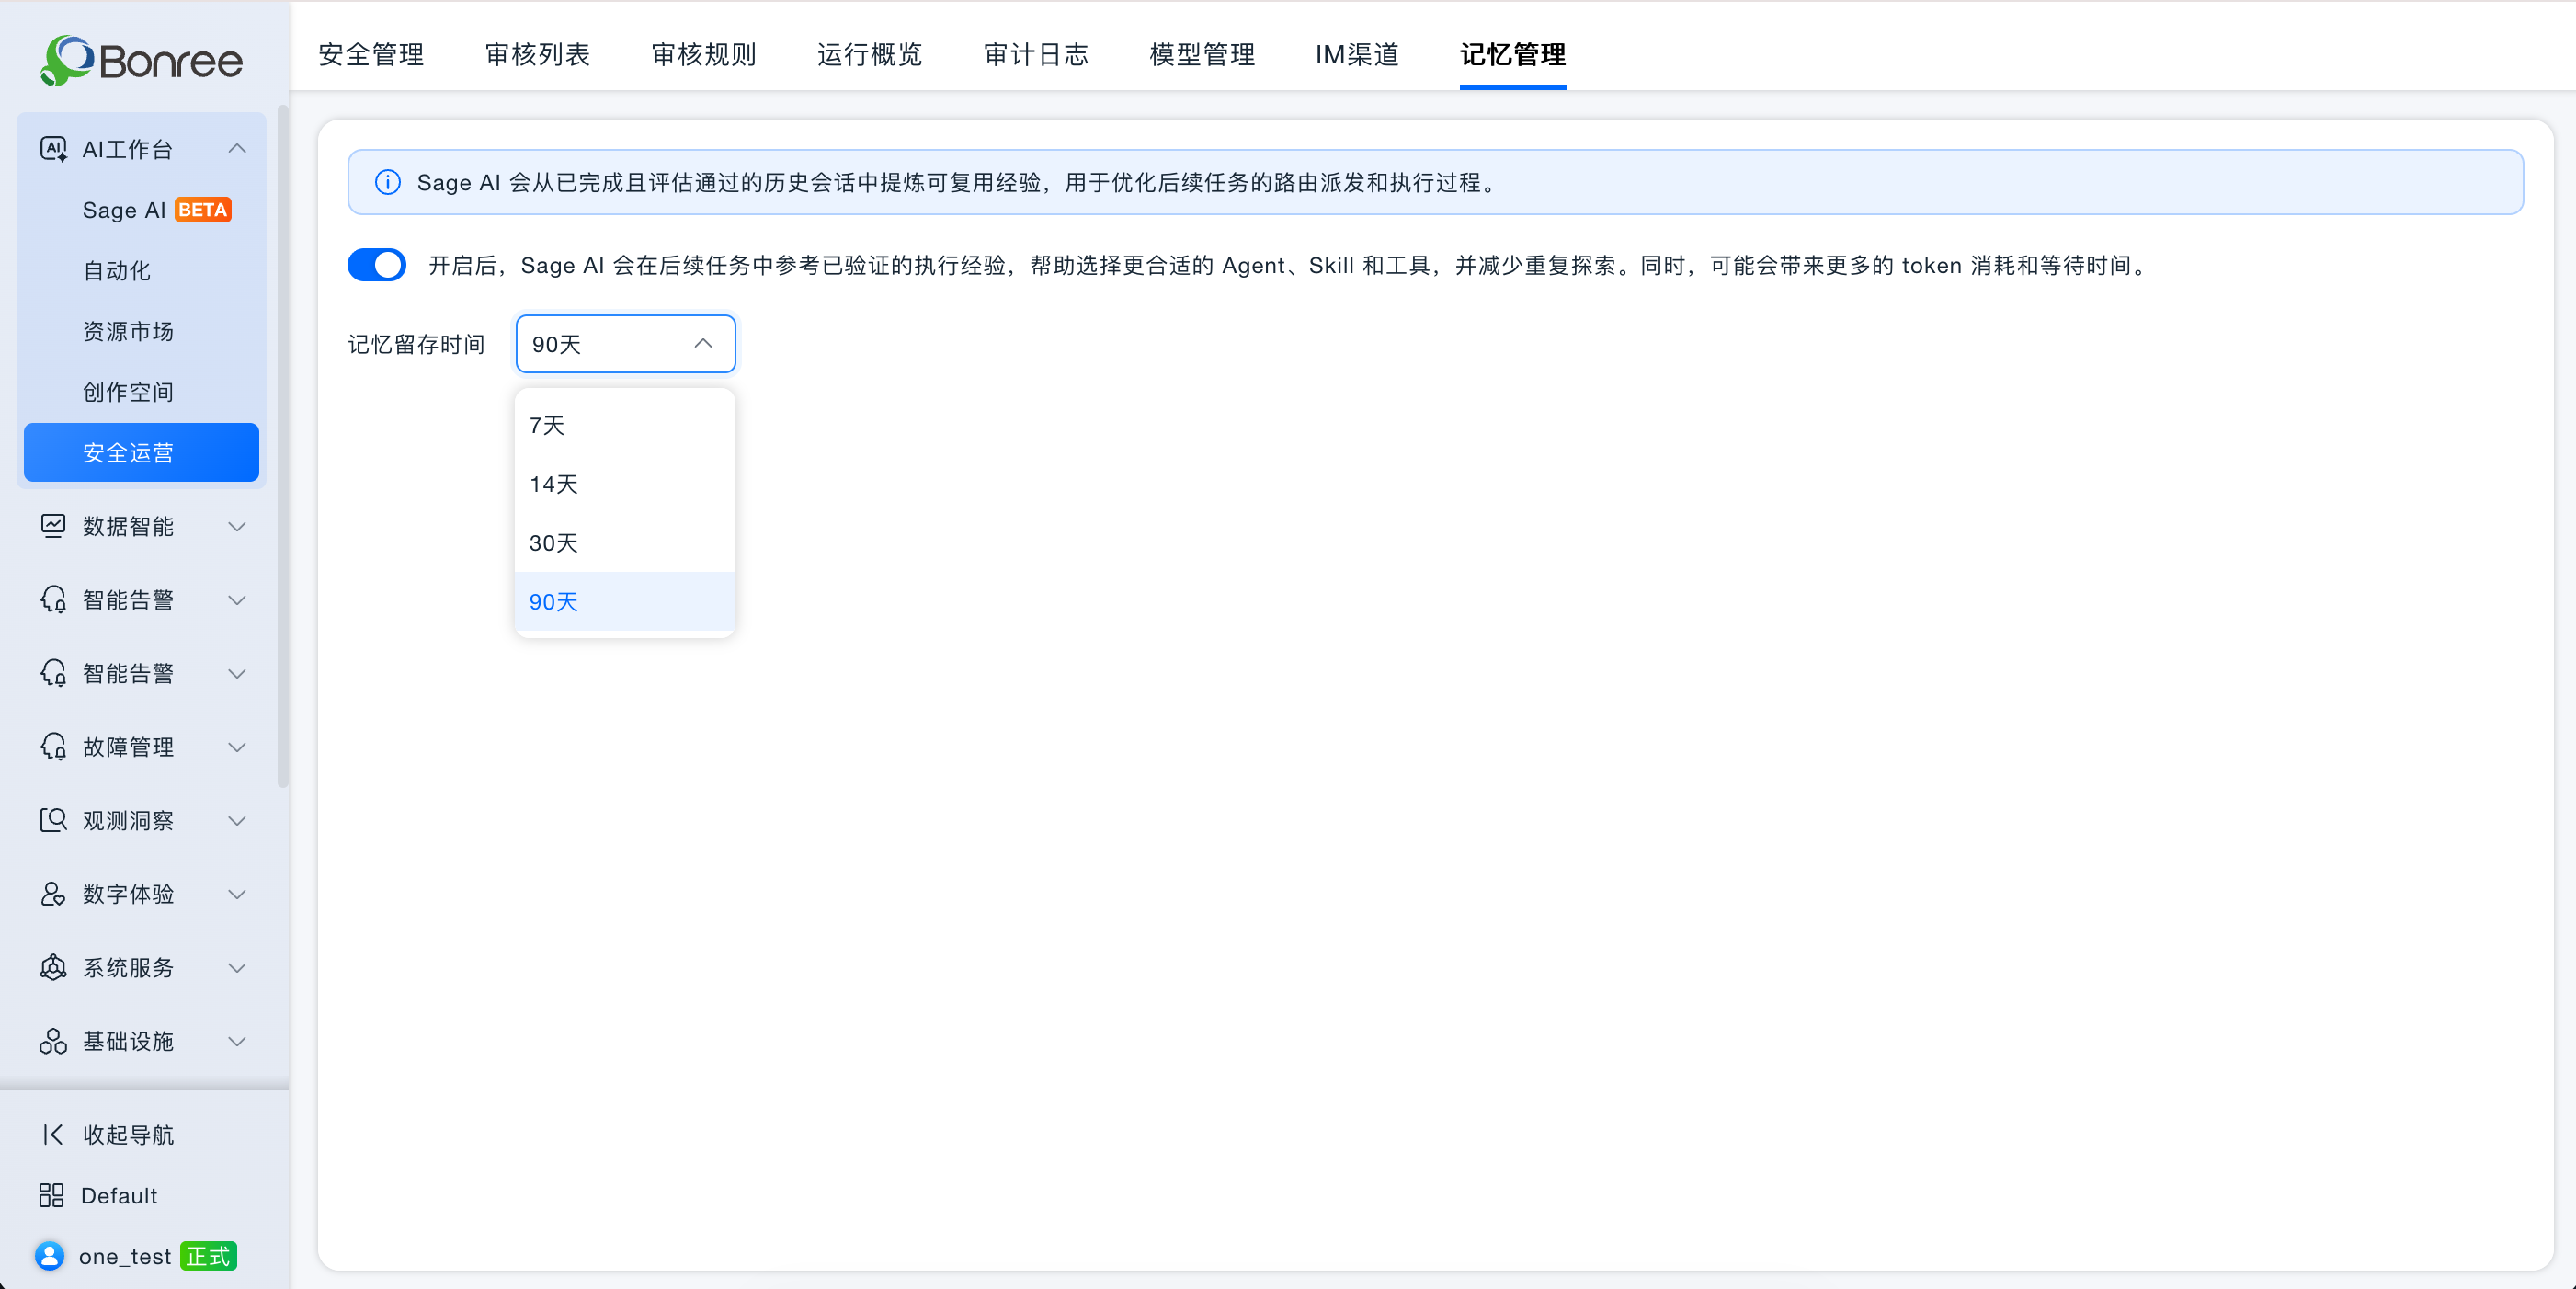
[Sage AI memory management]
Result notifications for automations. When an automation task finishes, it can send a report by email, webhook, WeCom, DingTalk, or Feishu. Notification records are available in the task log. Inspection results now reach the right people proactively, so no one has to check and forward reports by hand.
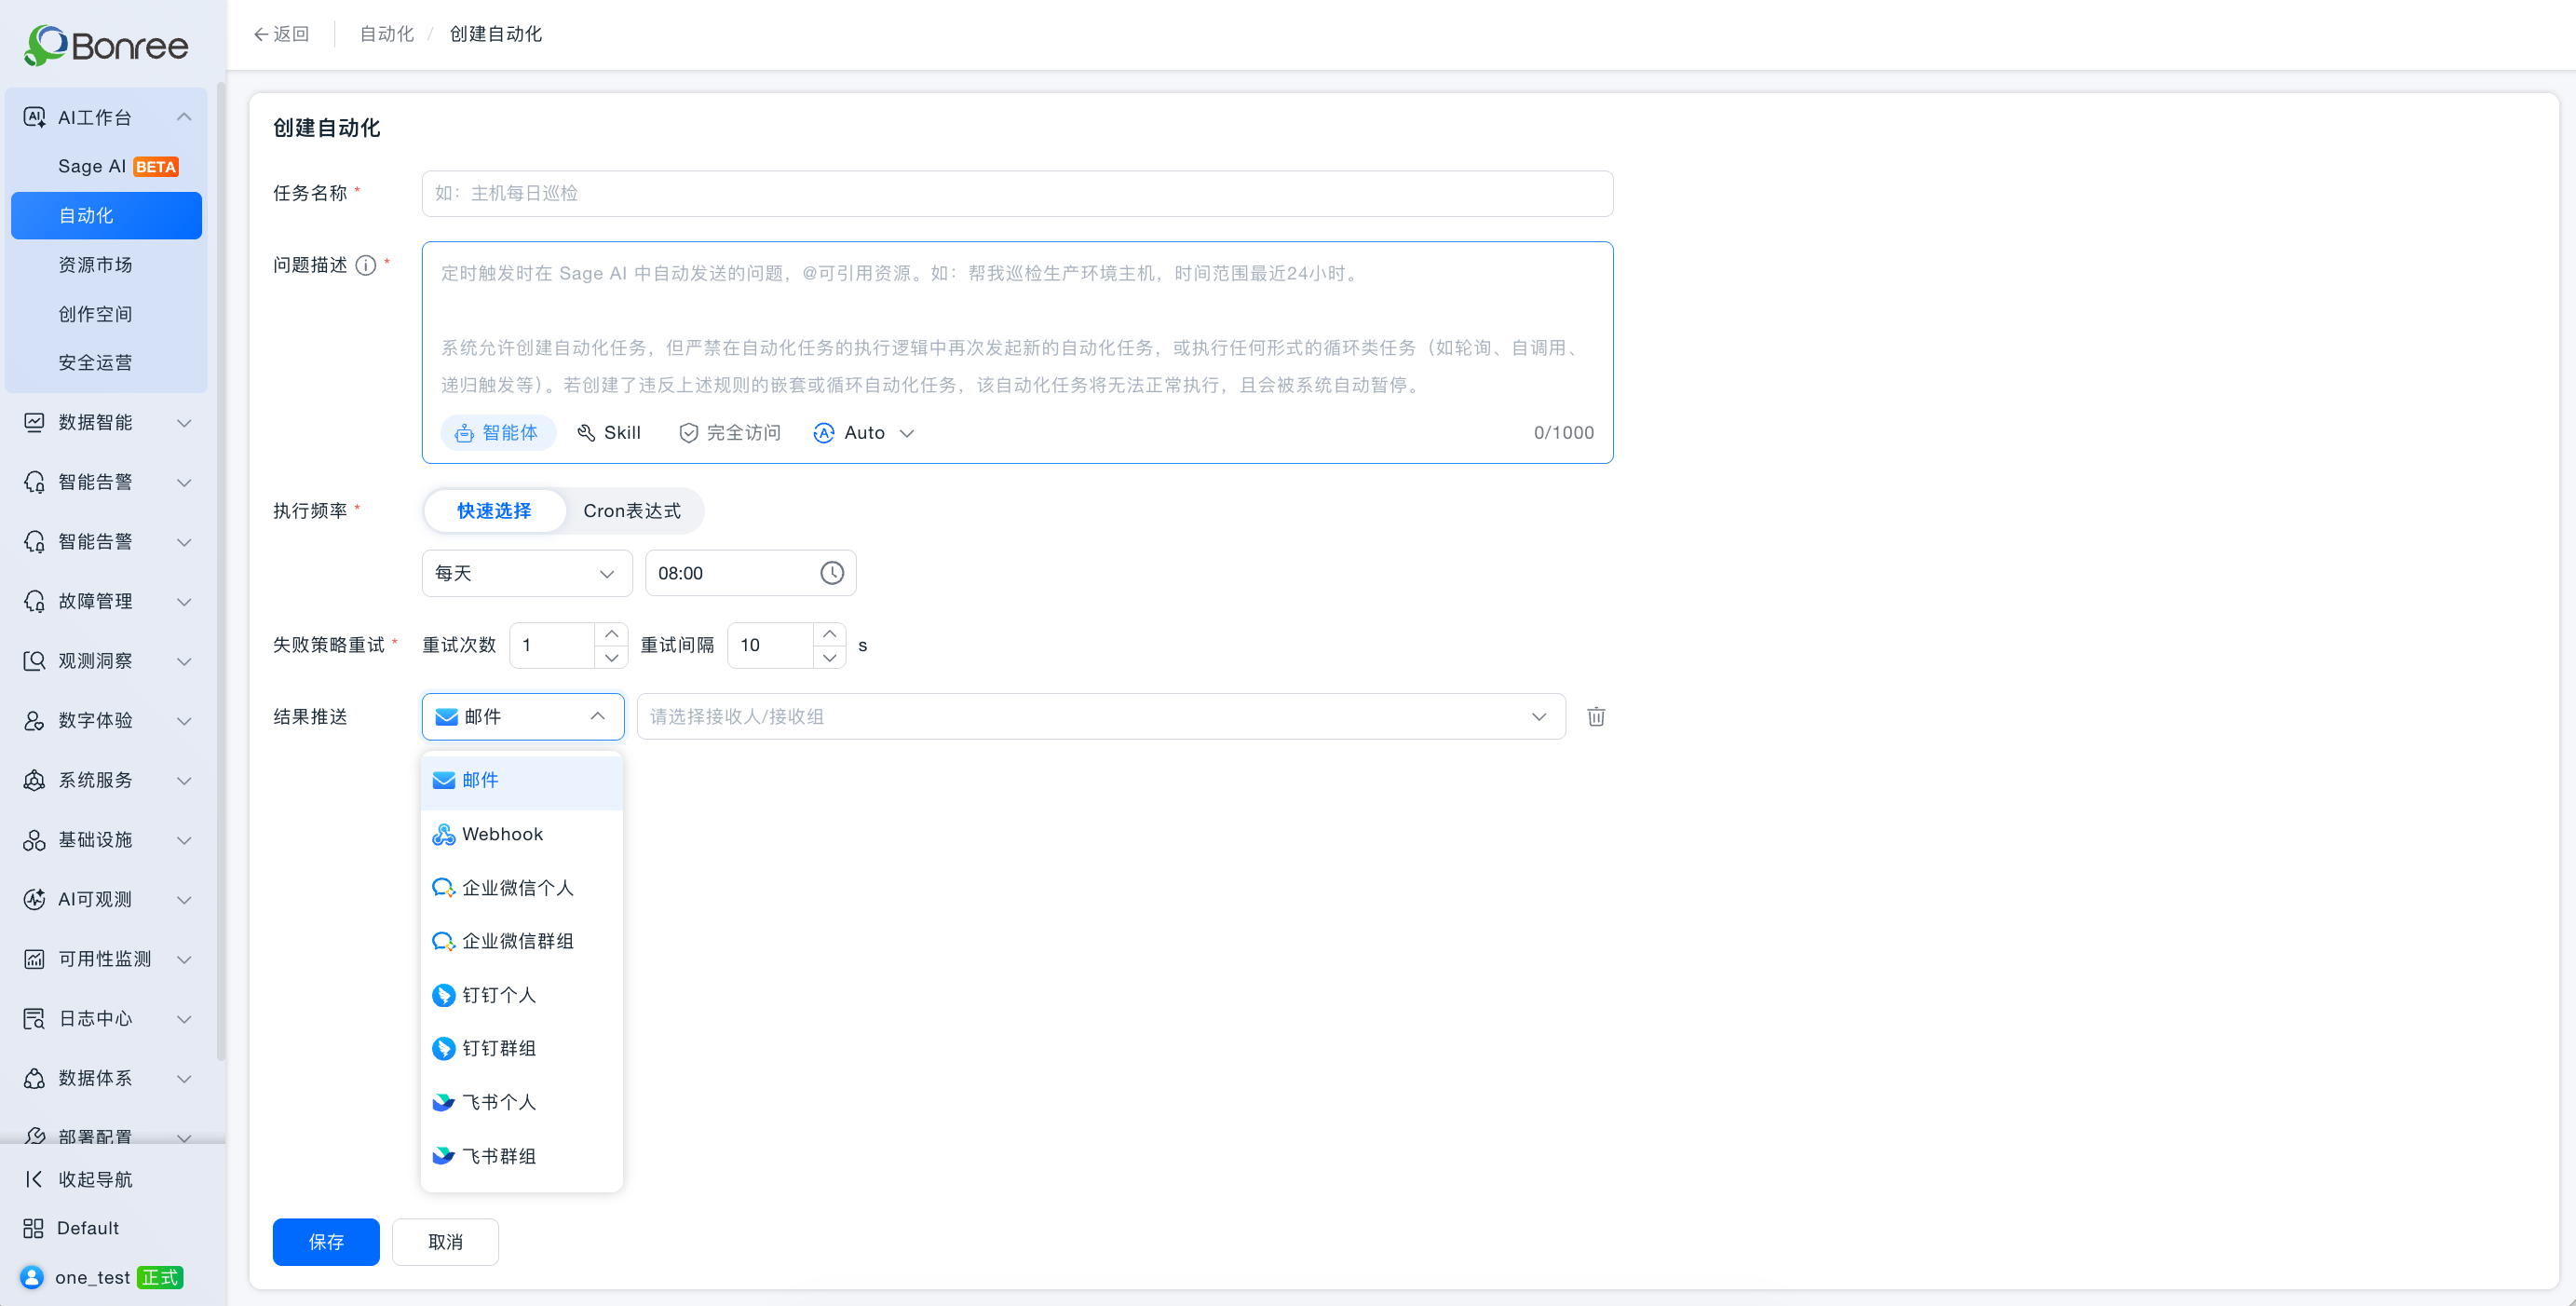
[Configuring automation result notifications]
Bulk import of AI resources. Knowledge bases, Skills, agents, and automations can be imported as a package by resource domain. Before importing, you can preview the list and choose, item by item, whether to keep, skip, or reference an existing resource. This makes it easier to reuse existing configurations across resource domains or environments, without creating and linking resources one at a time.
Read-only snapshots for published resources. When you apply to publish a resource, you can select the resource domains it covers. The system saves read-only snapshots of the knowledge bases, MCP servers, and Skills it references, which other users rely on when they add and run the resource. Shared resources stay pinned to a fixed version, so changes to the original resource are less likely to affect results.
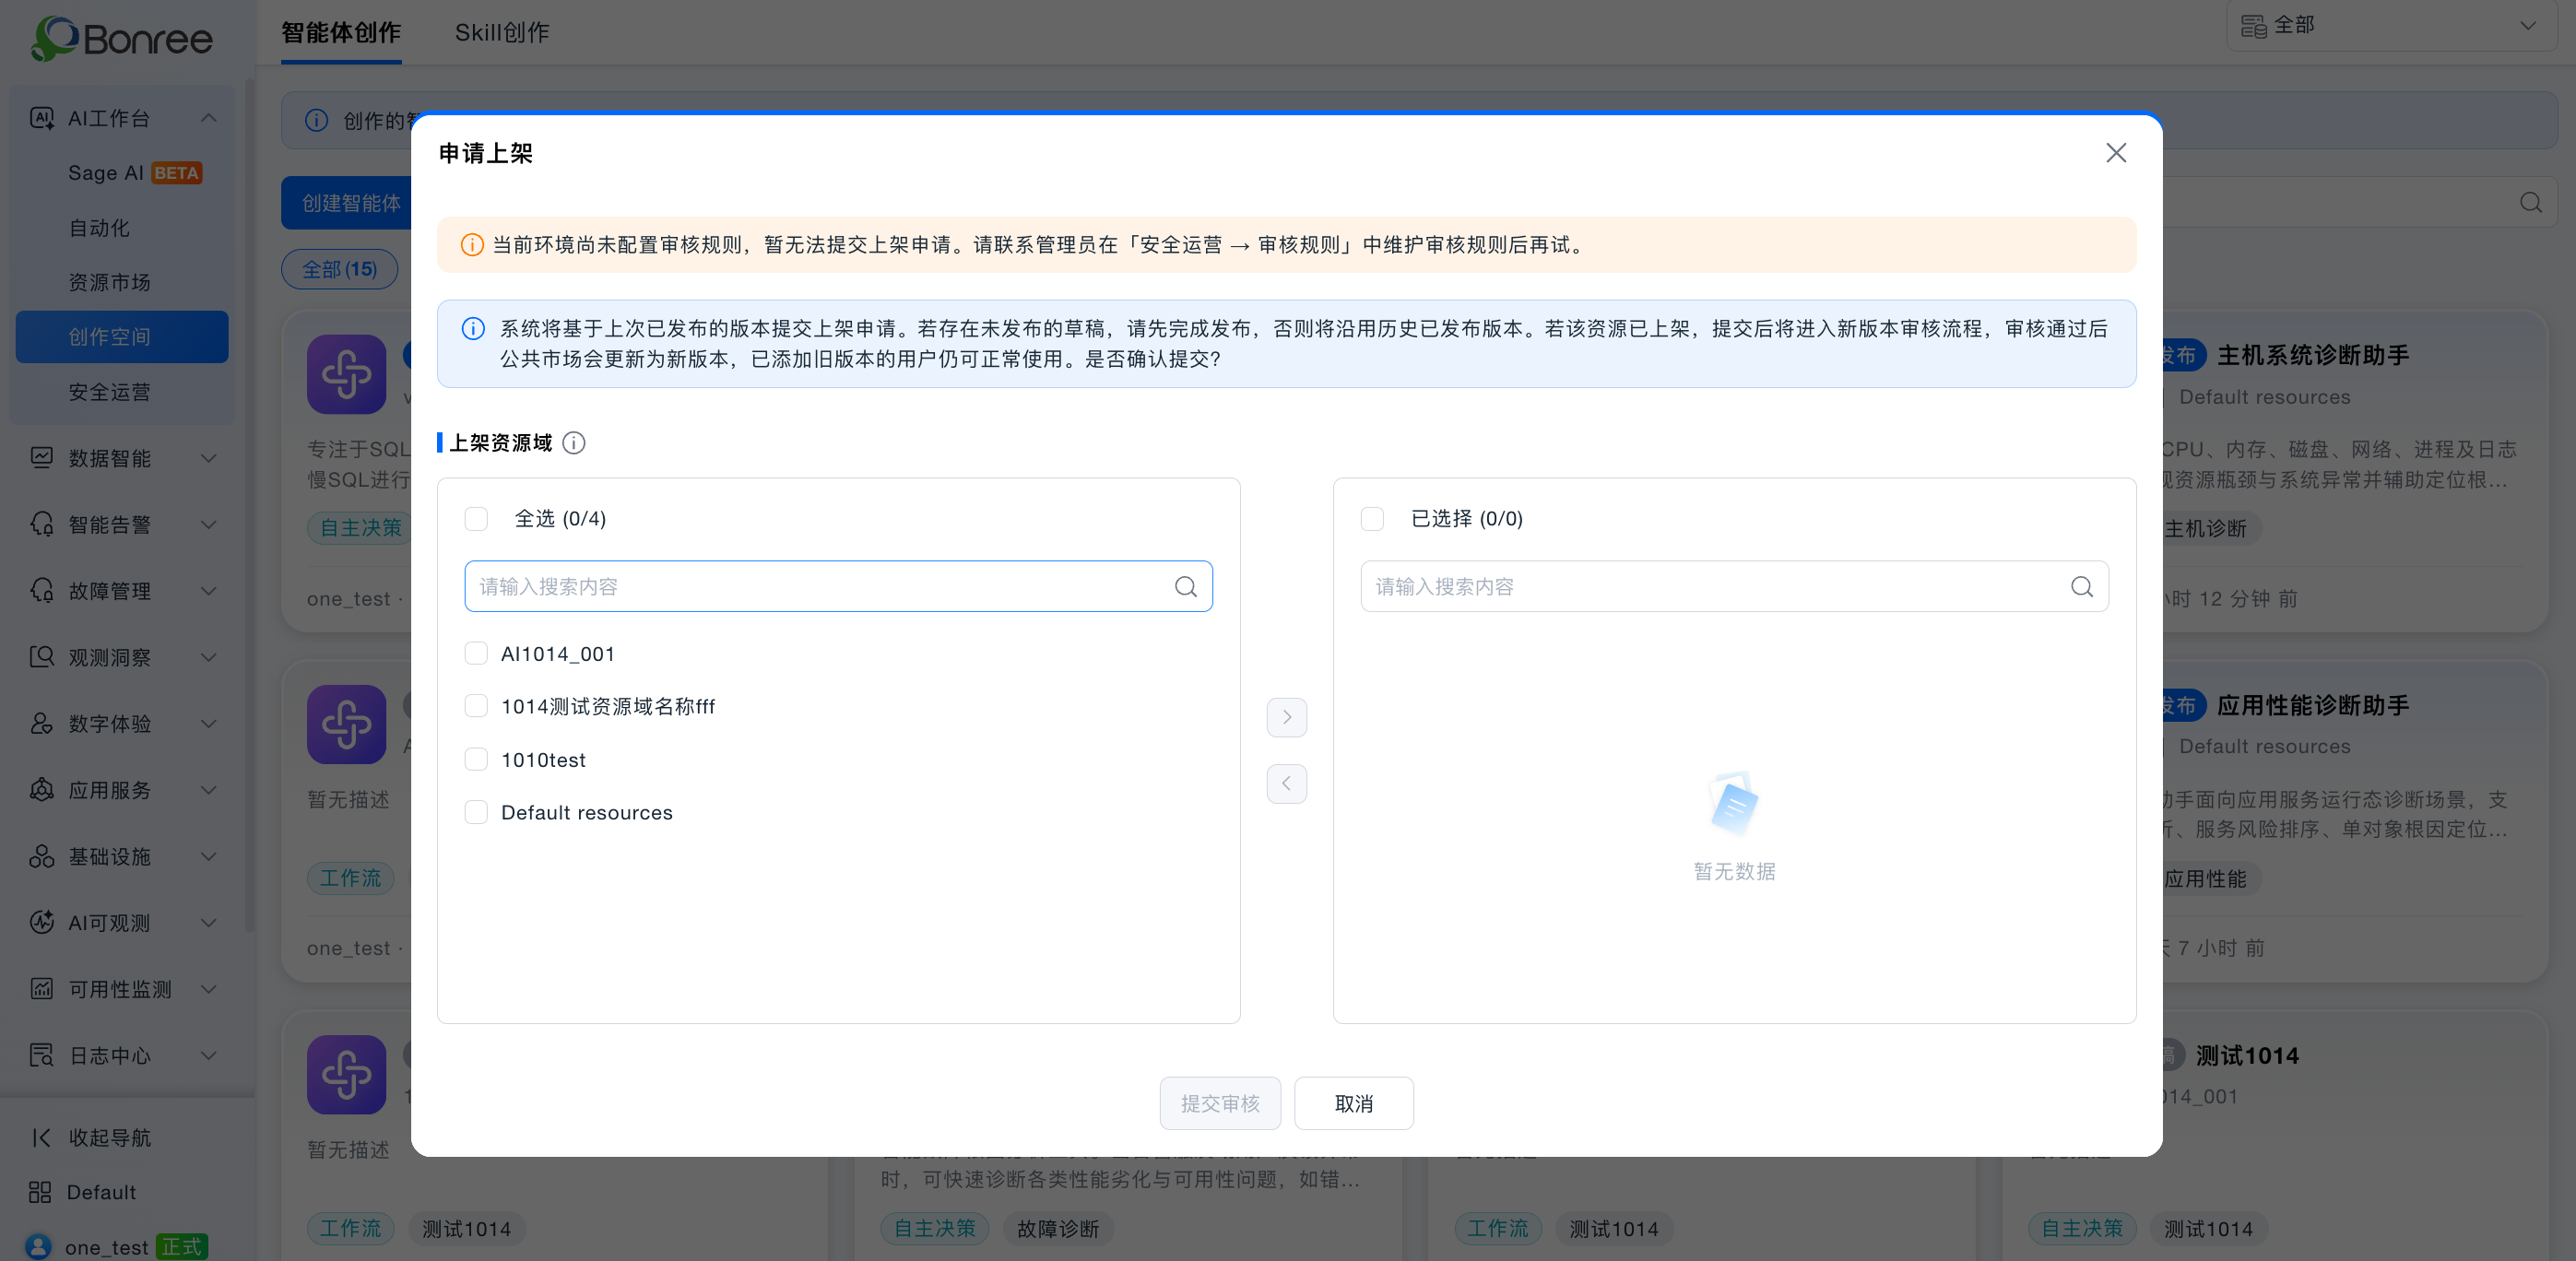
[Selecting the scope of a published resource]
APM (Application Performance Monitoring)
Trace archiving. You can save an entire trace from its details page and review it later in the archive list. Each archived copy is kept for 365 days from the time it is saved. Trace records are preserved for handovers and post-incident reviews, so teams can analyze a problem against the same evidence.
Topology export and intelligent analysis for business chains. You can adjust the weight of topology connections by throughput, response time, or error rate, and export the topology as a PNG. Business chains also support the built-in Sage AI agent. This makes it easier to compare how different call relationships perform and to share the chain structure with colleagues involved in troubleshooting.
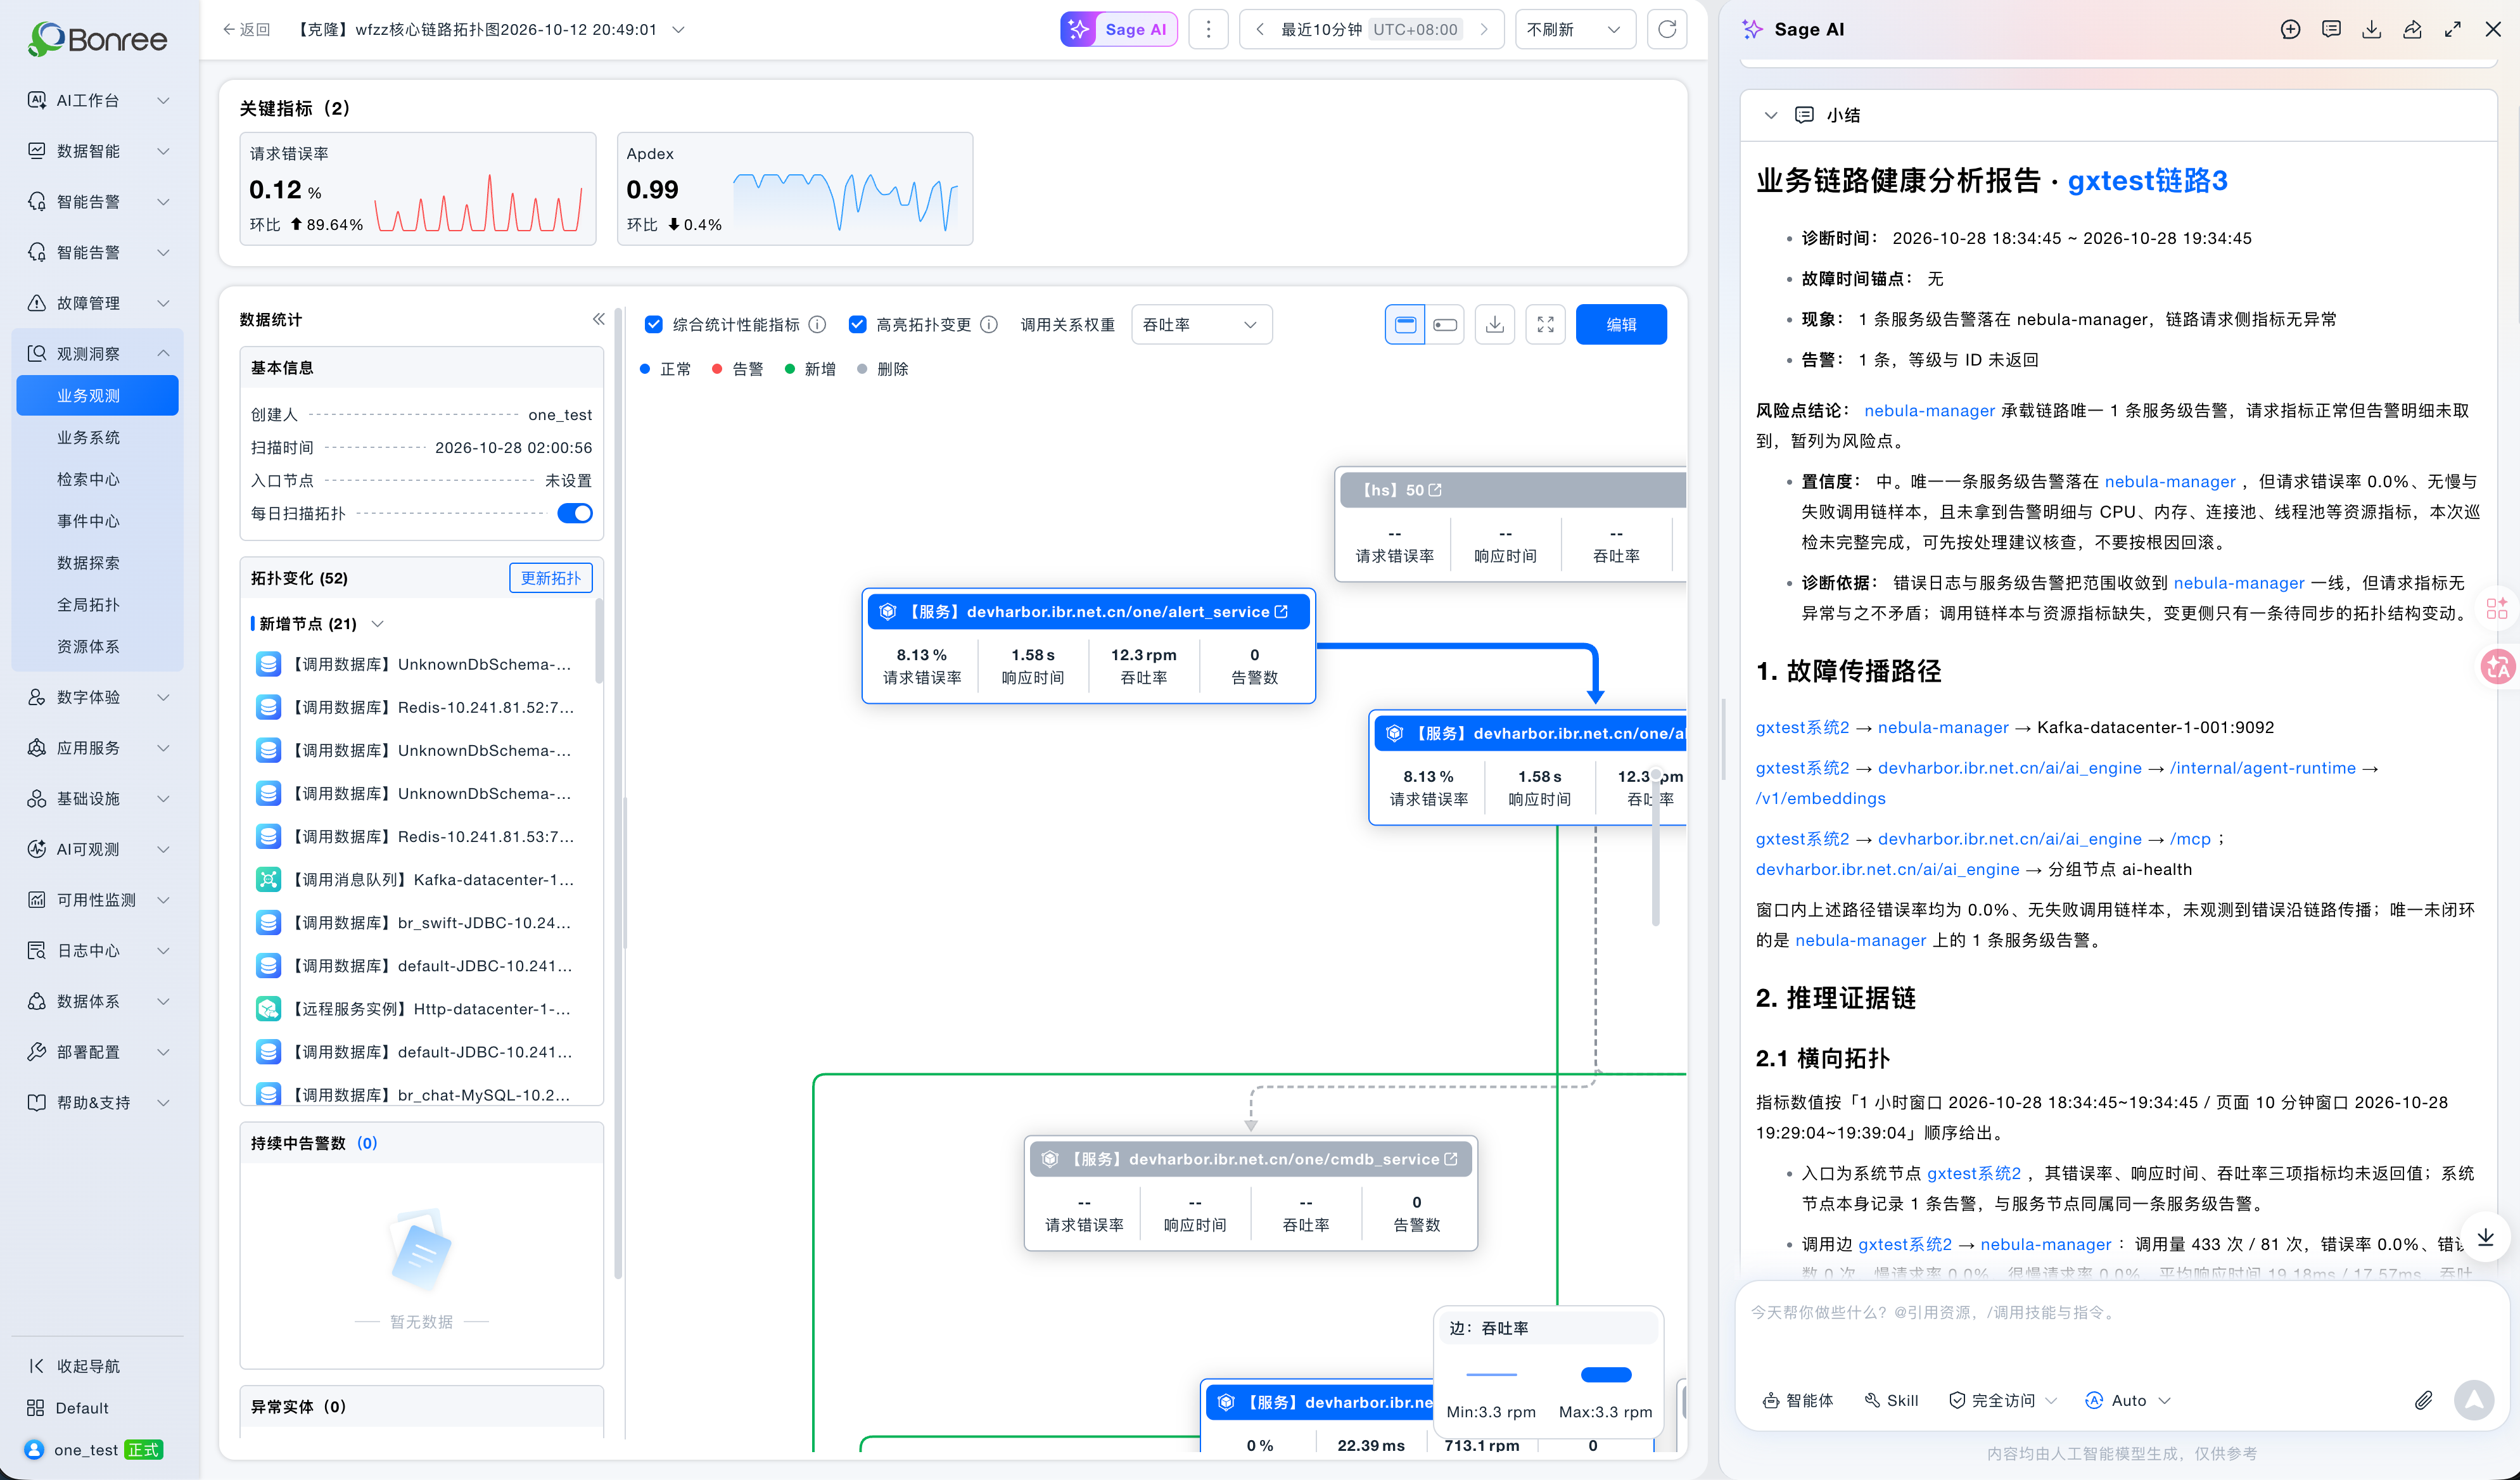
[ Using Sage AI in a business chain]
Improved synchronization of external business chains. Chains pending synchronization can be searched by name, and you can select the application they belong to. When a sync fails, you can view the reason and retry a single failed chain or all of them. This reduces the effort of locating target chains and repeating syncs, so missing business dependency information can be filled in promptly.
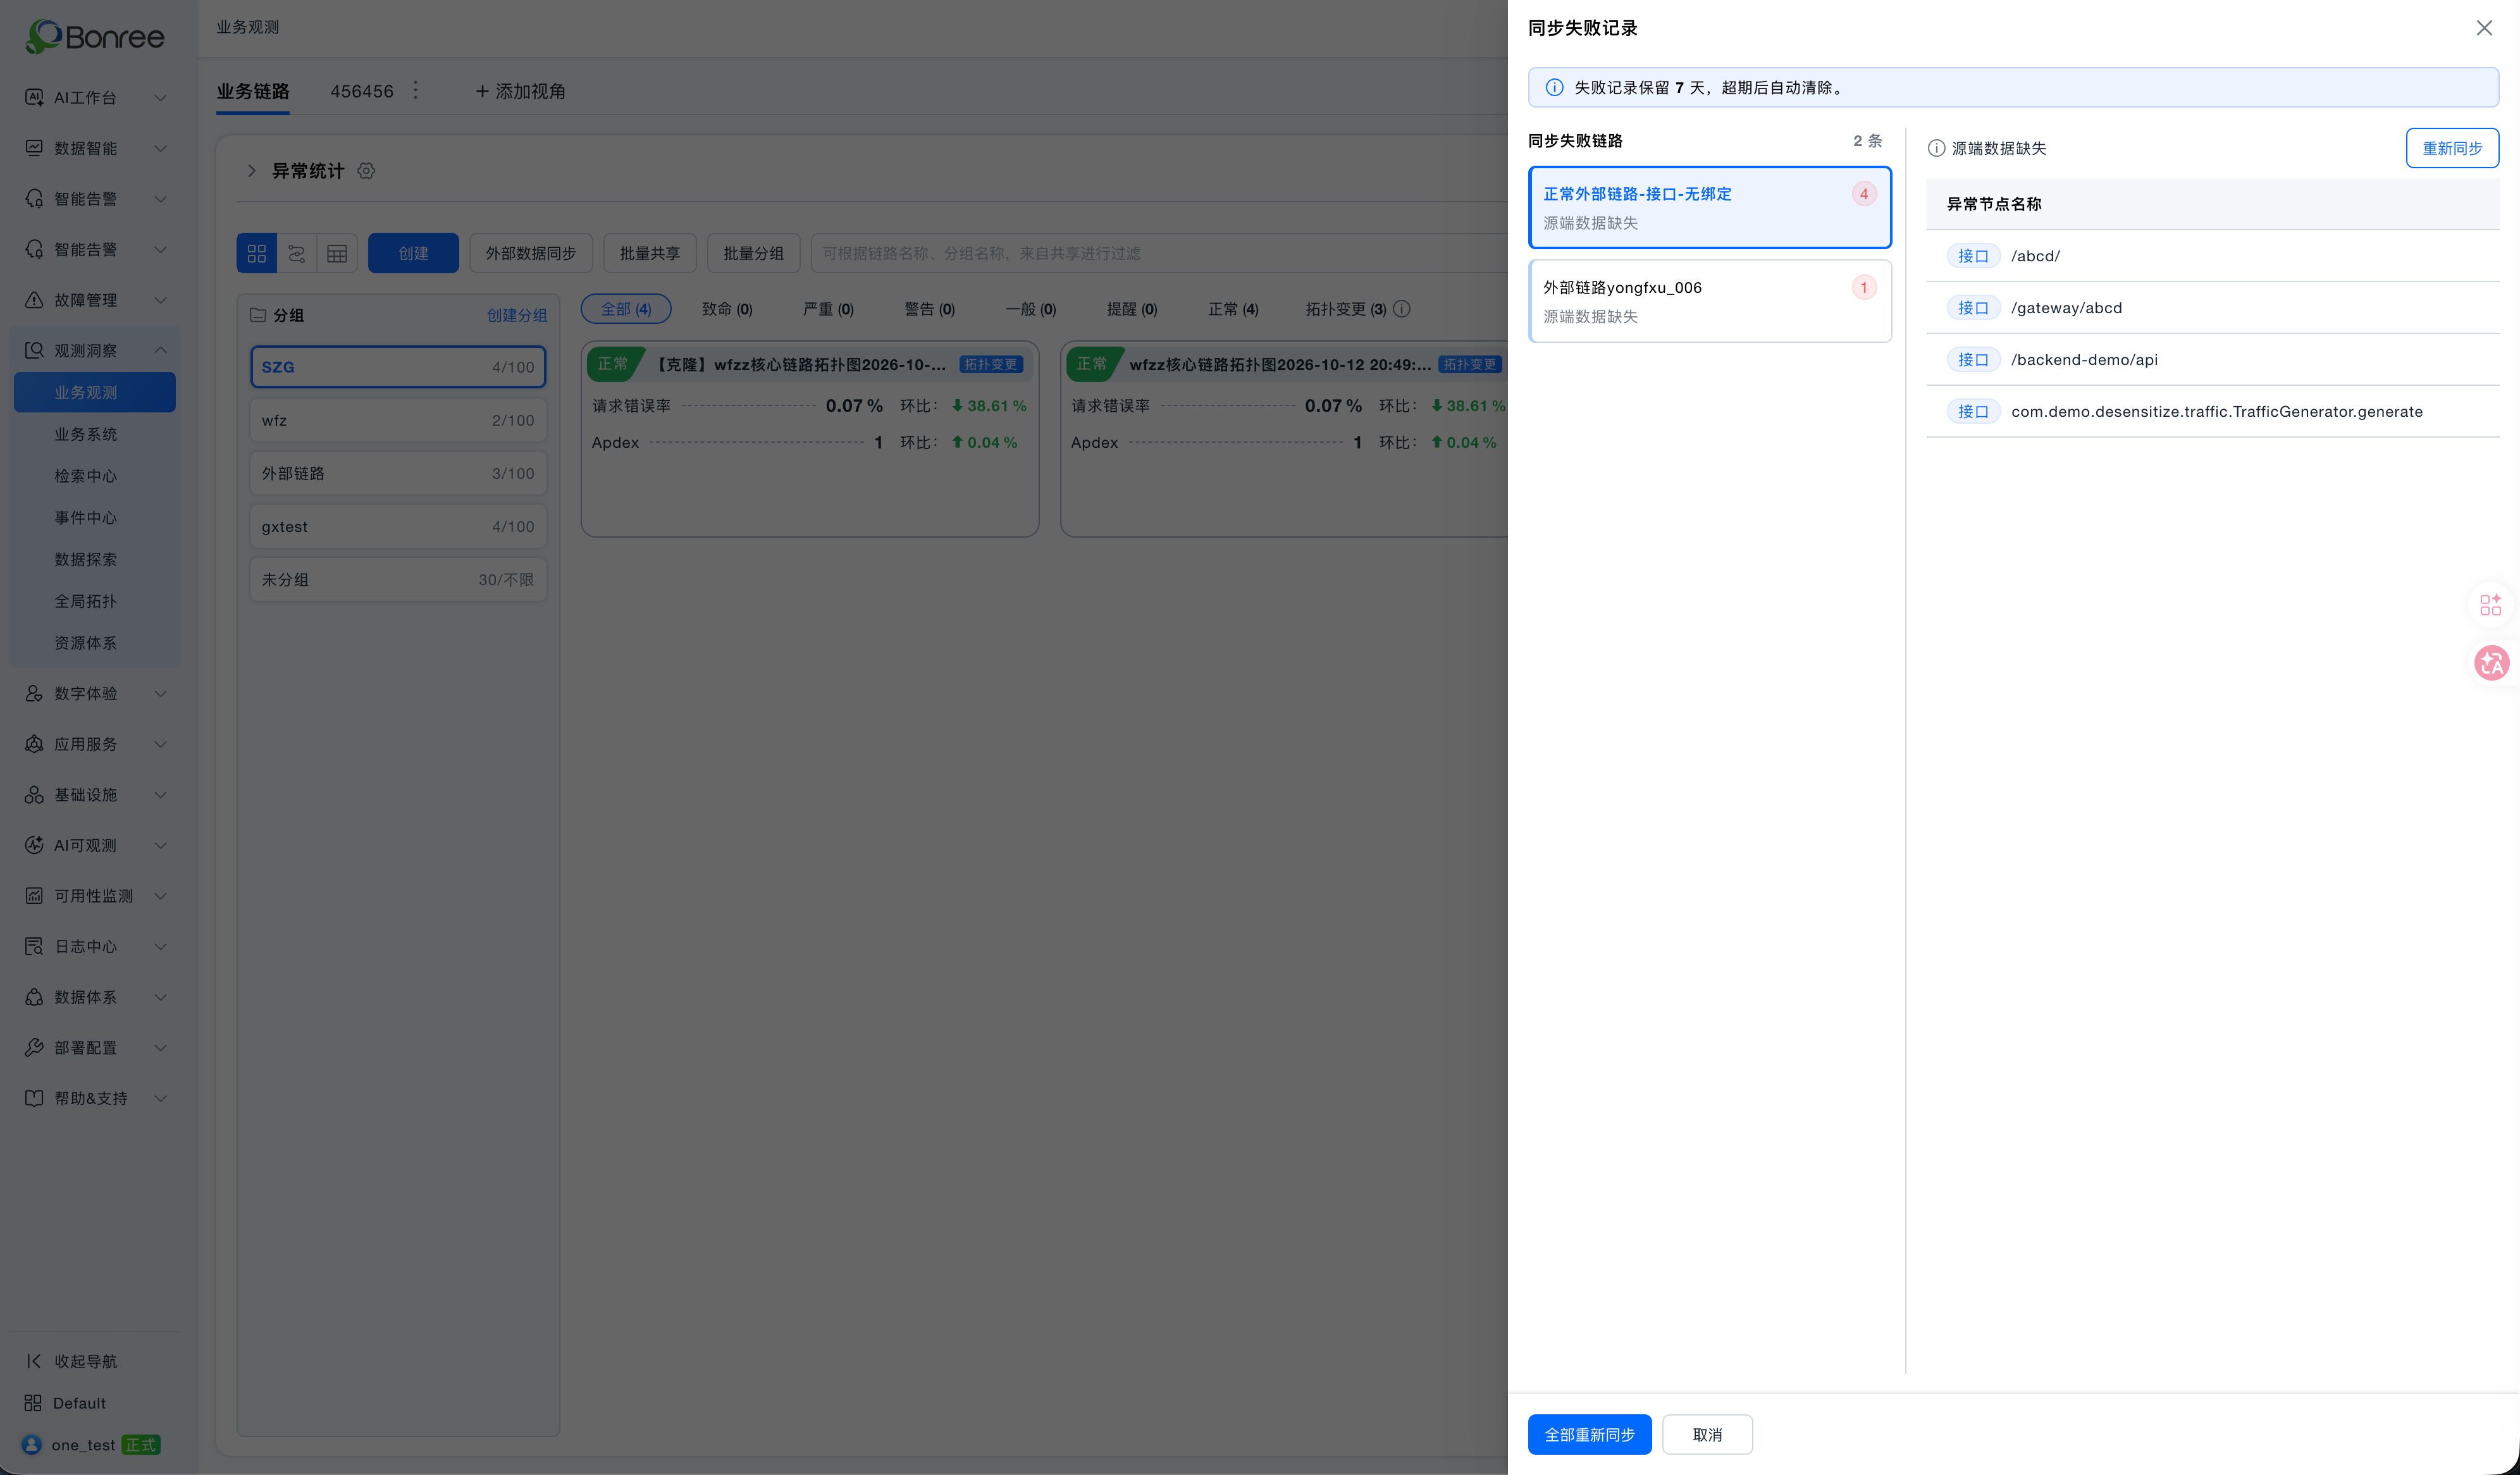
[External business chain synchronization]
MBean rule import and export. You can bulk import custom MBean collection rules from an Excel template, and export existing rules for reuse in other environments. This saves repeated data entry across similar environments and makes custom collection rules easier to maintain consistently.
Custom views for entity details. Existing dashboards can now be added to the detail pages of service instances, endpoints, key methods, databases, message queues, remote service instances and endpoints, and hosts and containers. The charts you need for troubleshooting are gathered in one place, with less switching between dashboards.
[Image: Custom view for entity details]
Favorites for services and service instances. You can favorite the services or service instances you check most often and pin them to the top of the list. Favorites apply to the current account. On-call engineers can reach frequently used services faster, with less repeated searching.
Improved resource usage analysis. The service instance memory chart now shows process memory usage relative to the host and container RSS memory usage, along with metric sources, notes on how each metric is calculated, and an entry point to metric analysis. This helps distinguish process memory from container memory and reduces misjudgments caused by mixing calculation methods.
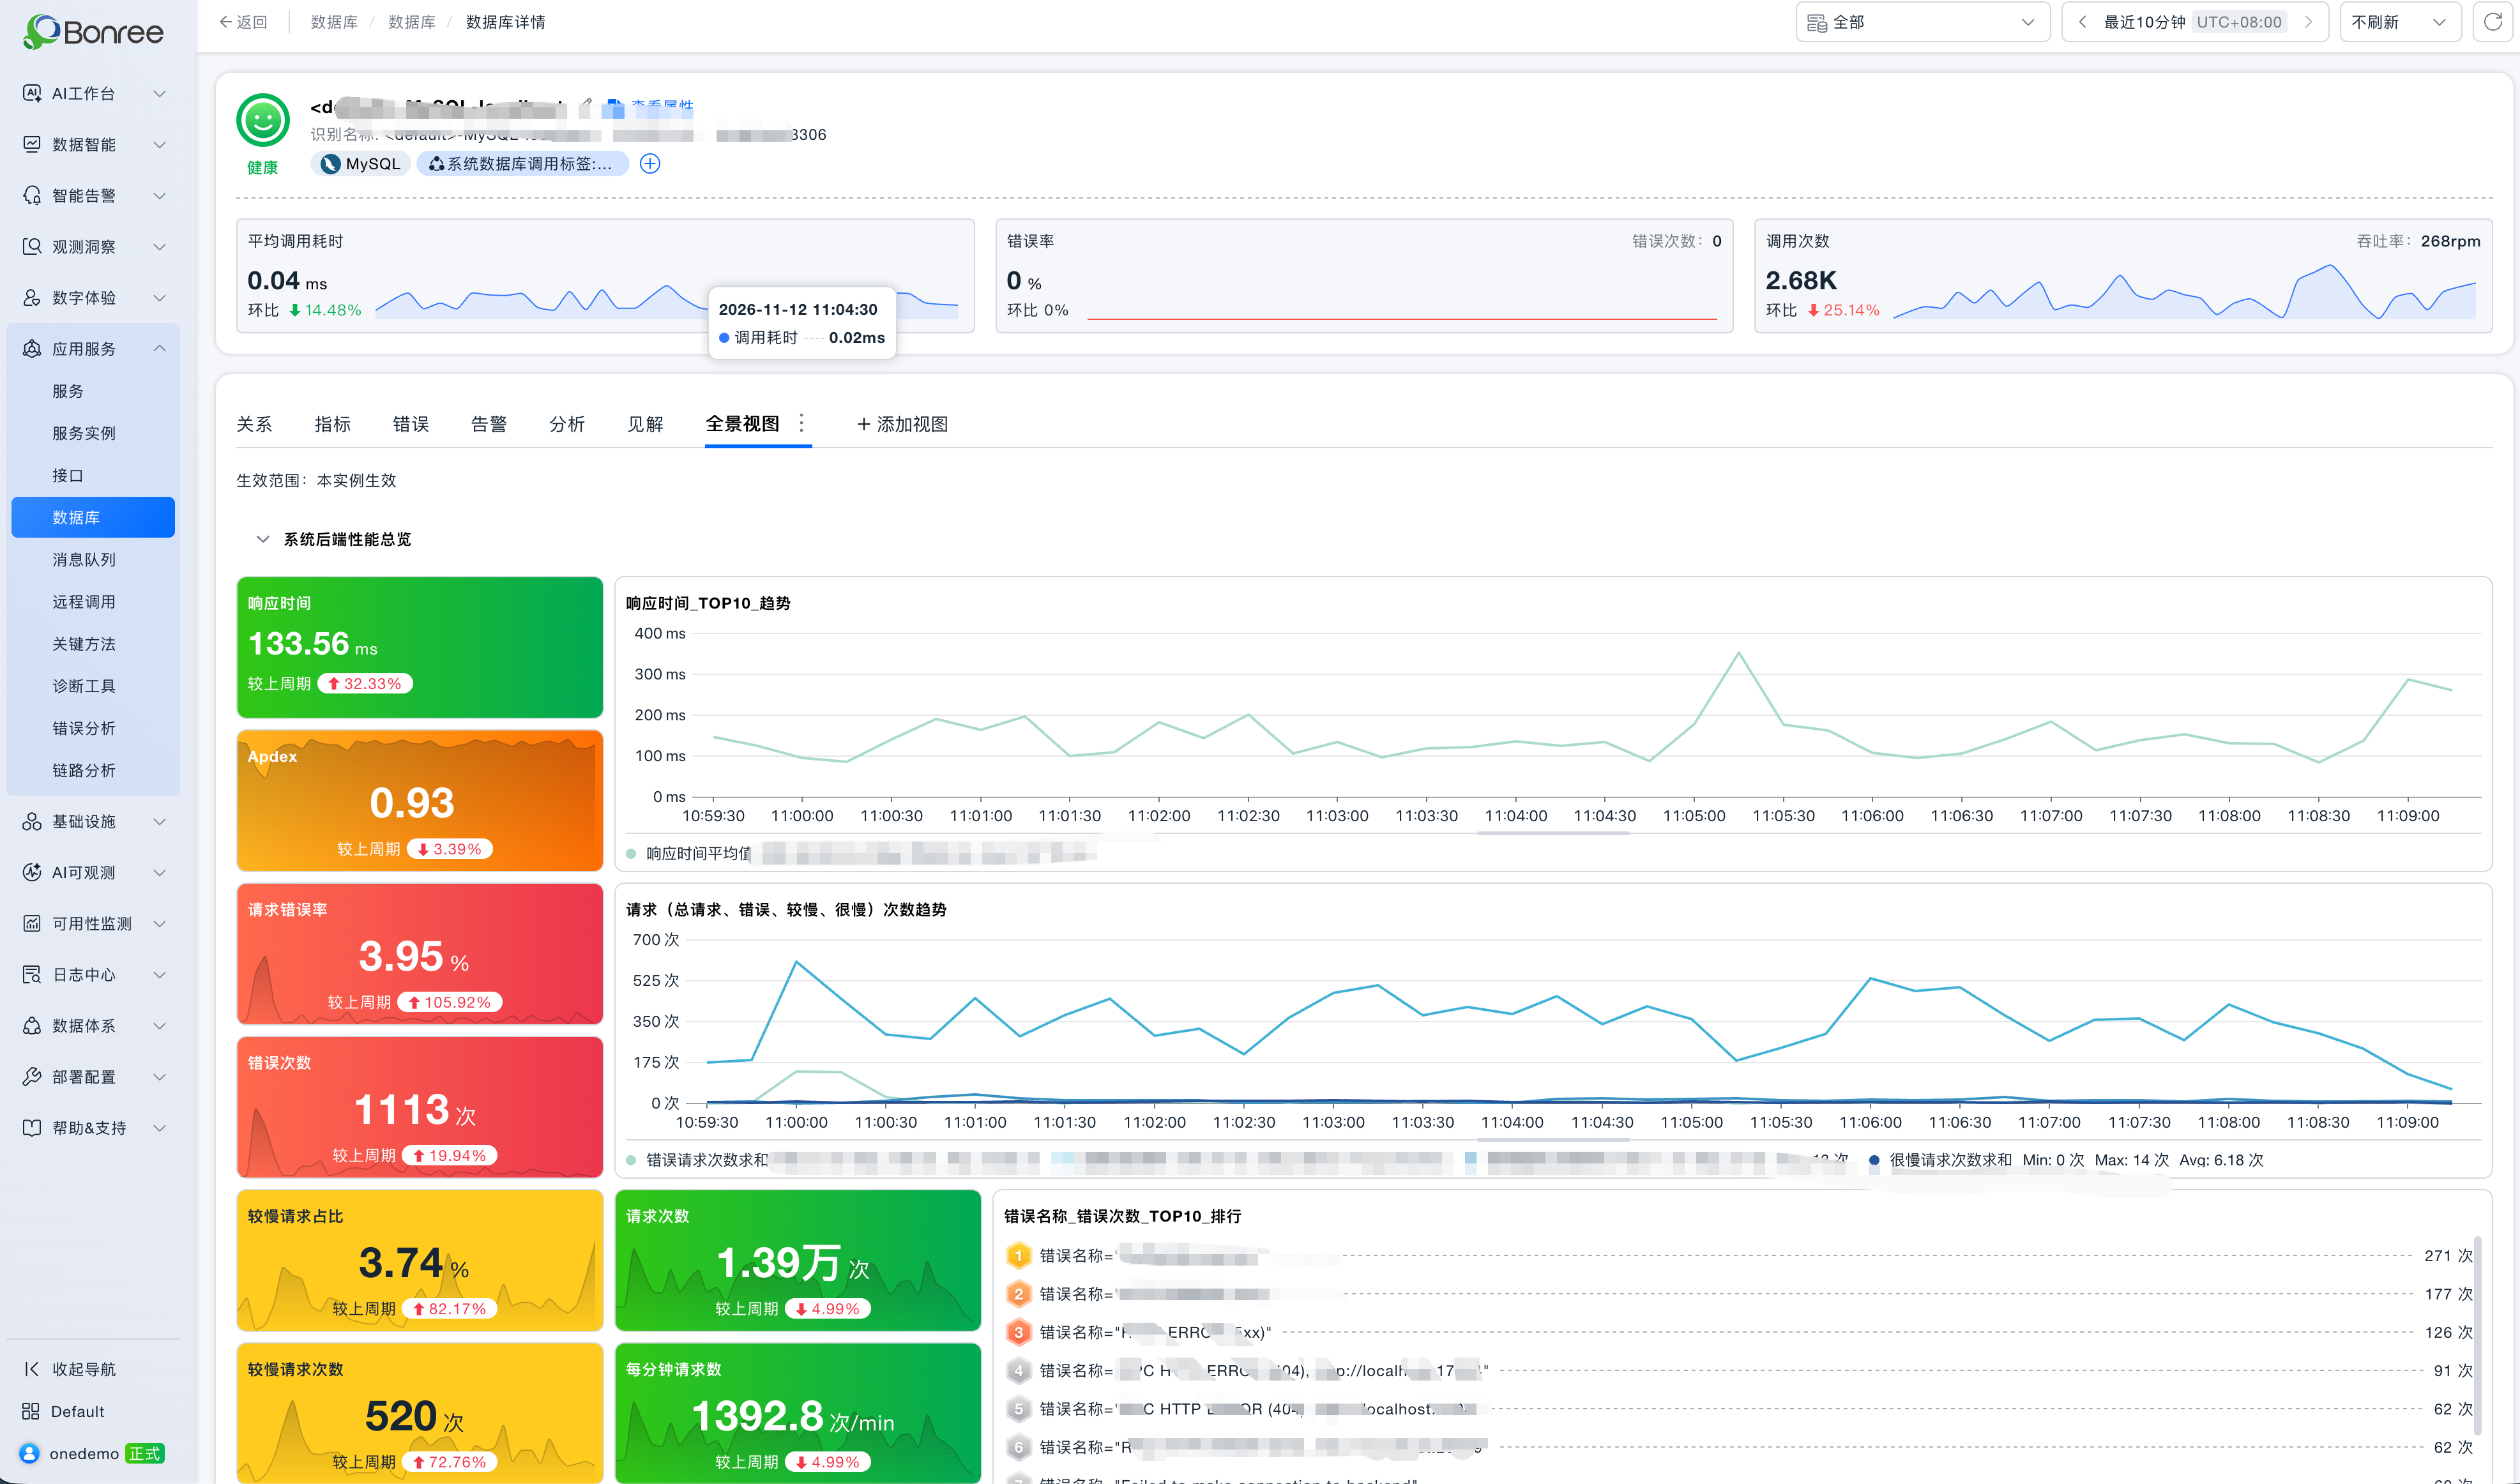
[Service instance resource usage analysis]
CMDB (Resource Management)
Instance metric analysis page. You can analyze how an abnormal instance’s metrics have changed over time to help find the cause. Trends and historical comparisons narrow the scope of investigation, so you no longer have to check metrics one by one.
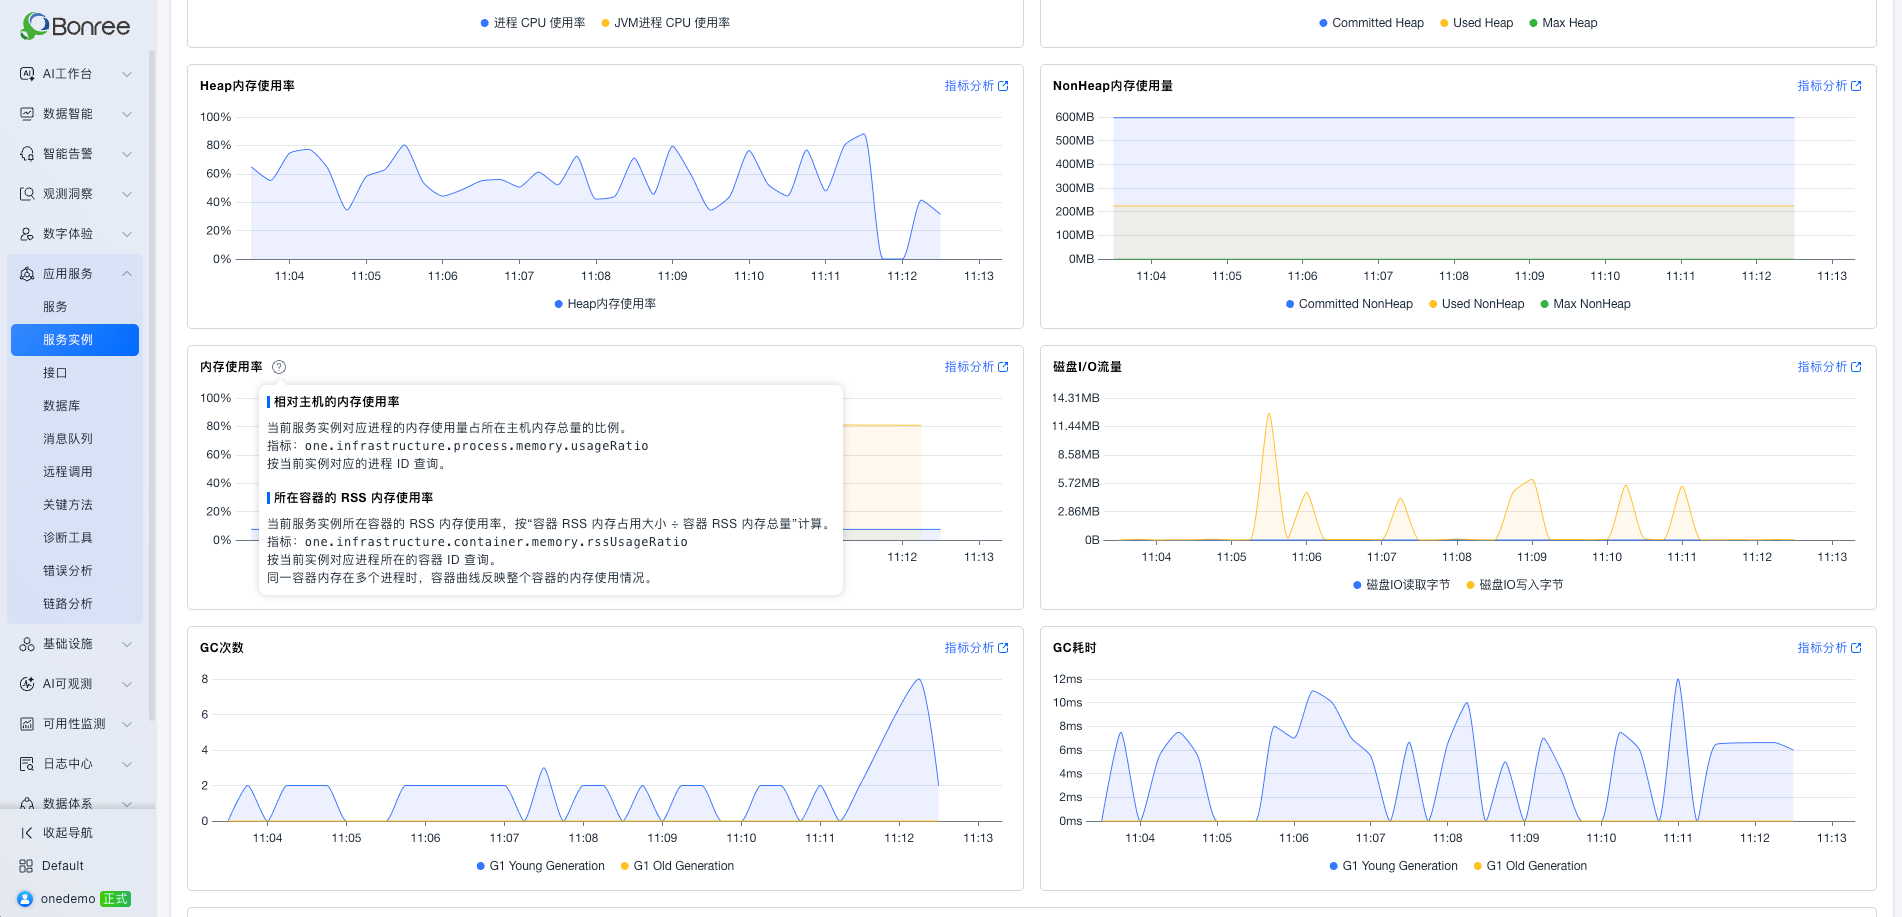
[Instance metric analysis page]
Instance views. You can build a dedicated dashboard for an instance to see key metrics and running status at a glance. Commonly used monitoring information is gathered on the instance details page, which makes routine inspections and quick checks during an incident easier.
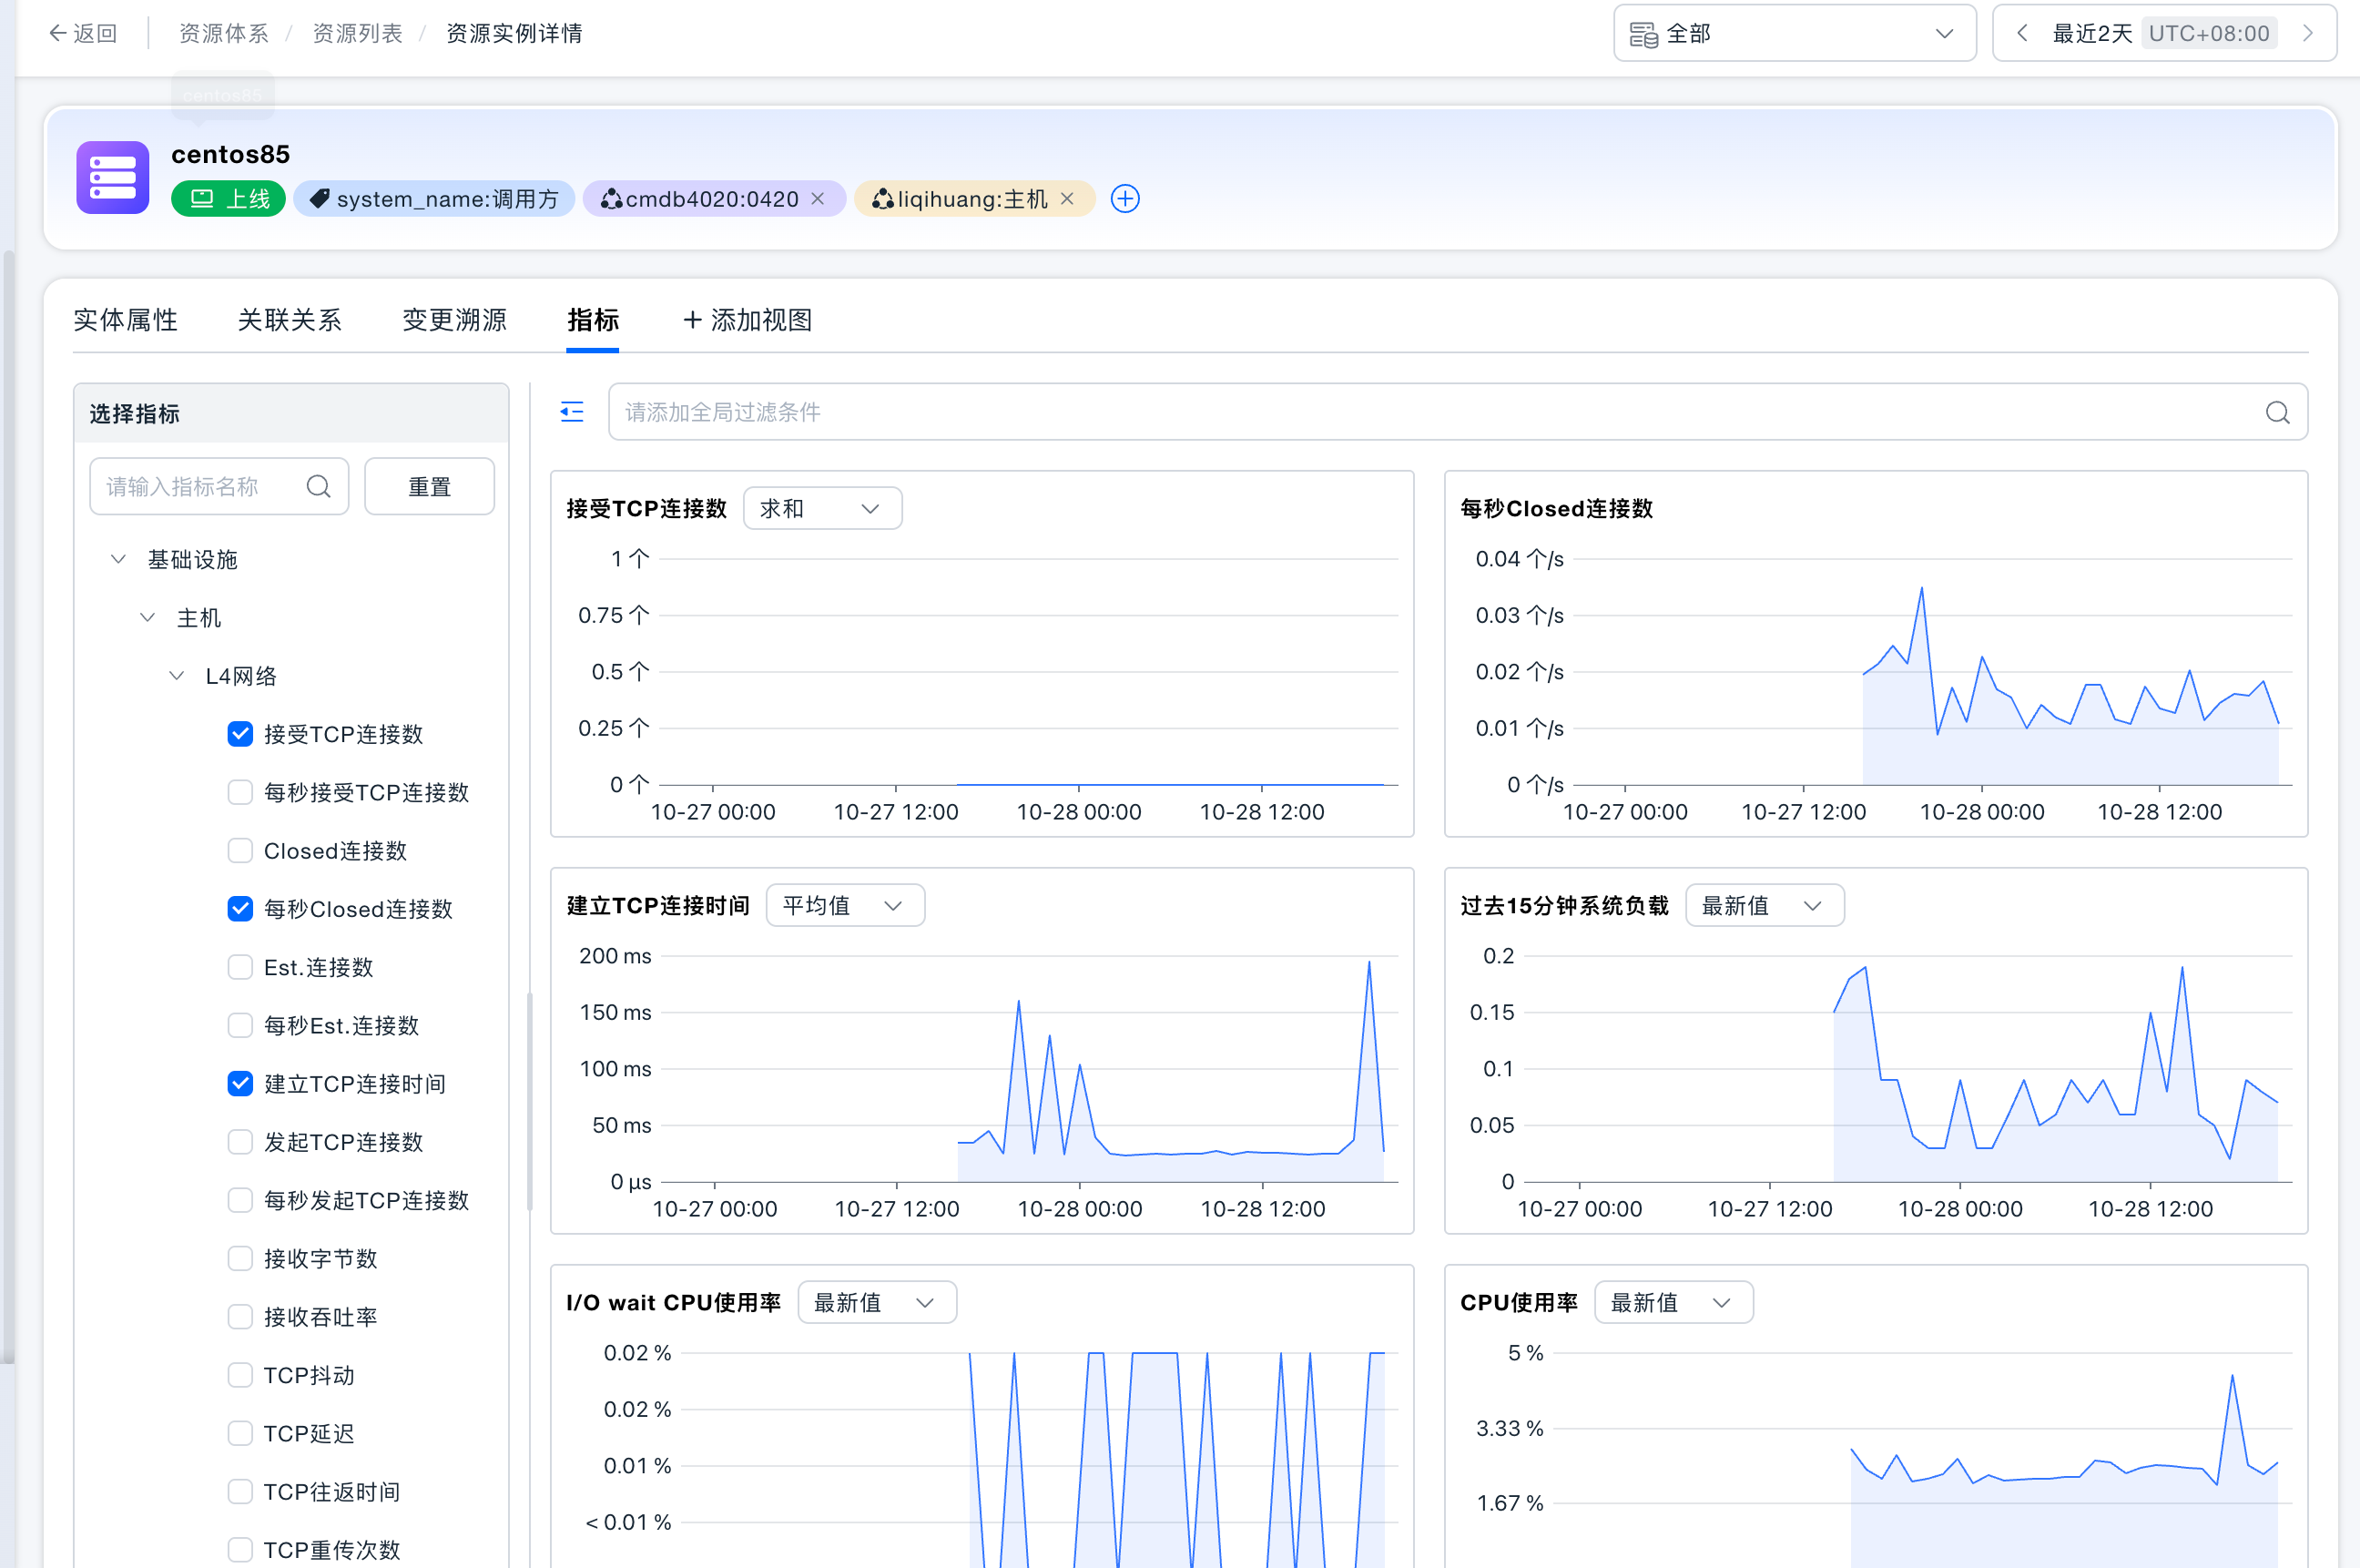
[Dedicated instance view]
Improved instance relationship list. You can view an instance’s first-degree upstream and downstream relationships and follow them layer by layer to locate the trigger of an anomaly and assess its blast radius. Tracing an anomaly to its source, and to the objects it may affect, gives you a basis for deciding what to handle first.
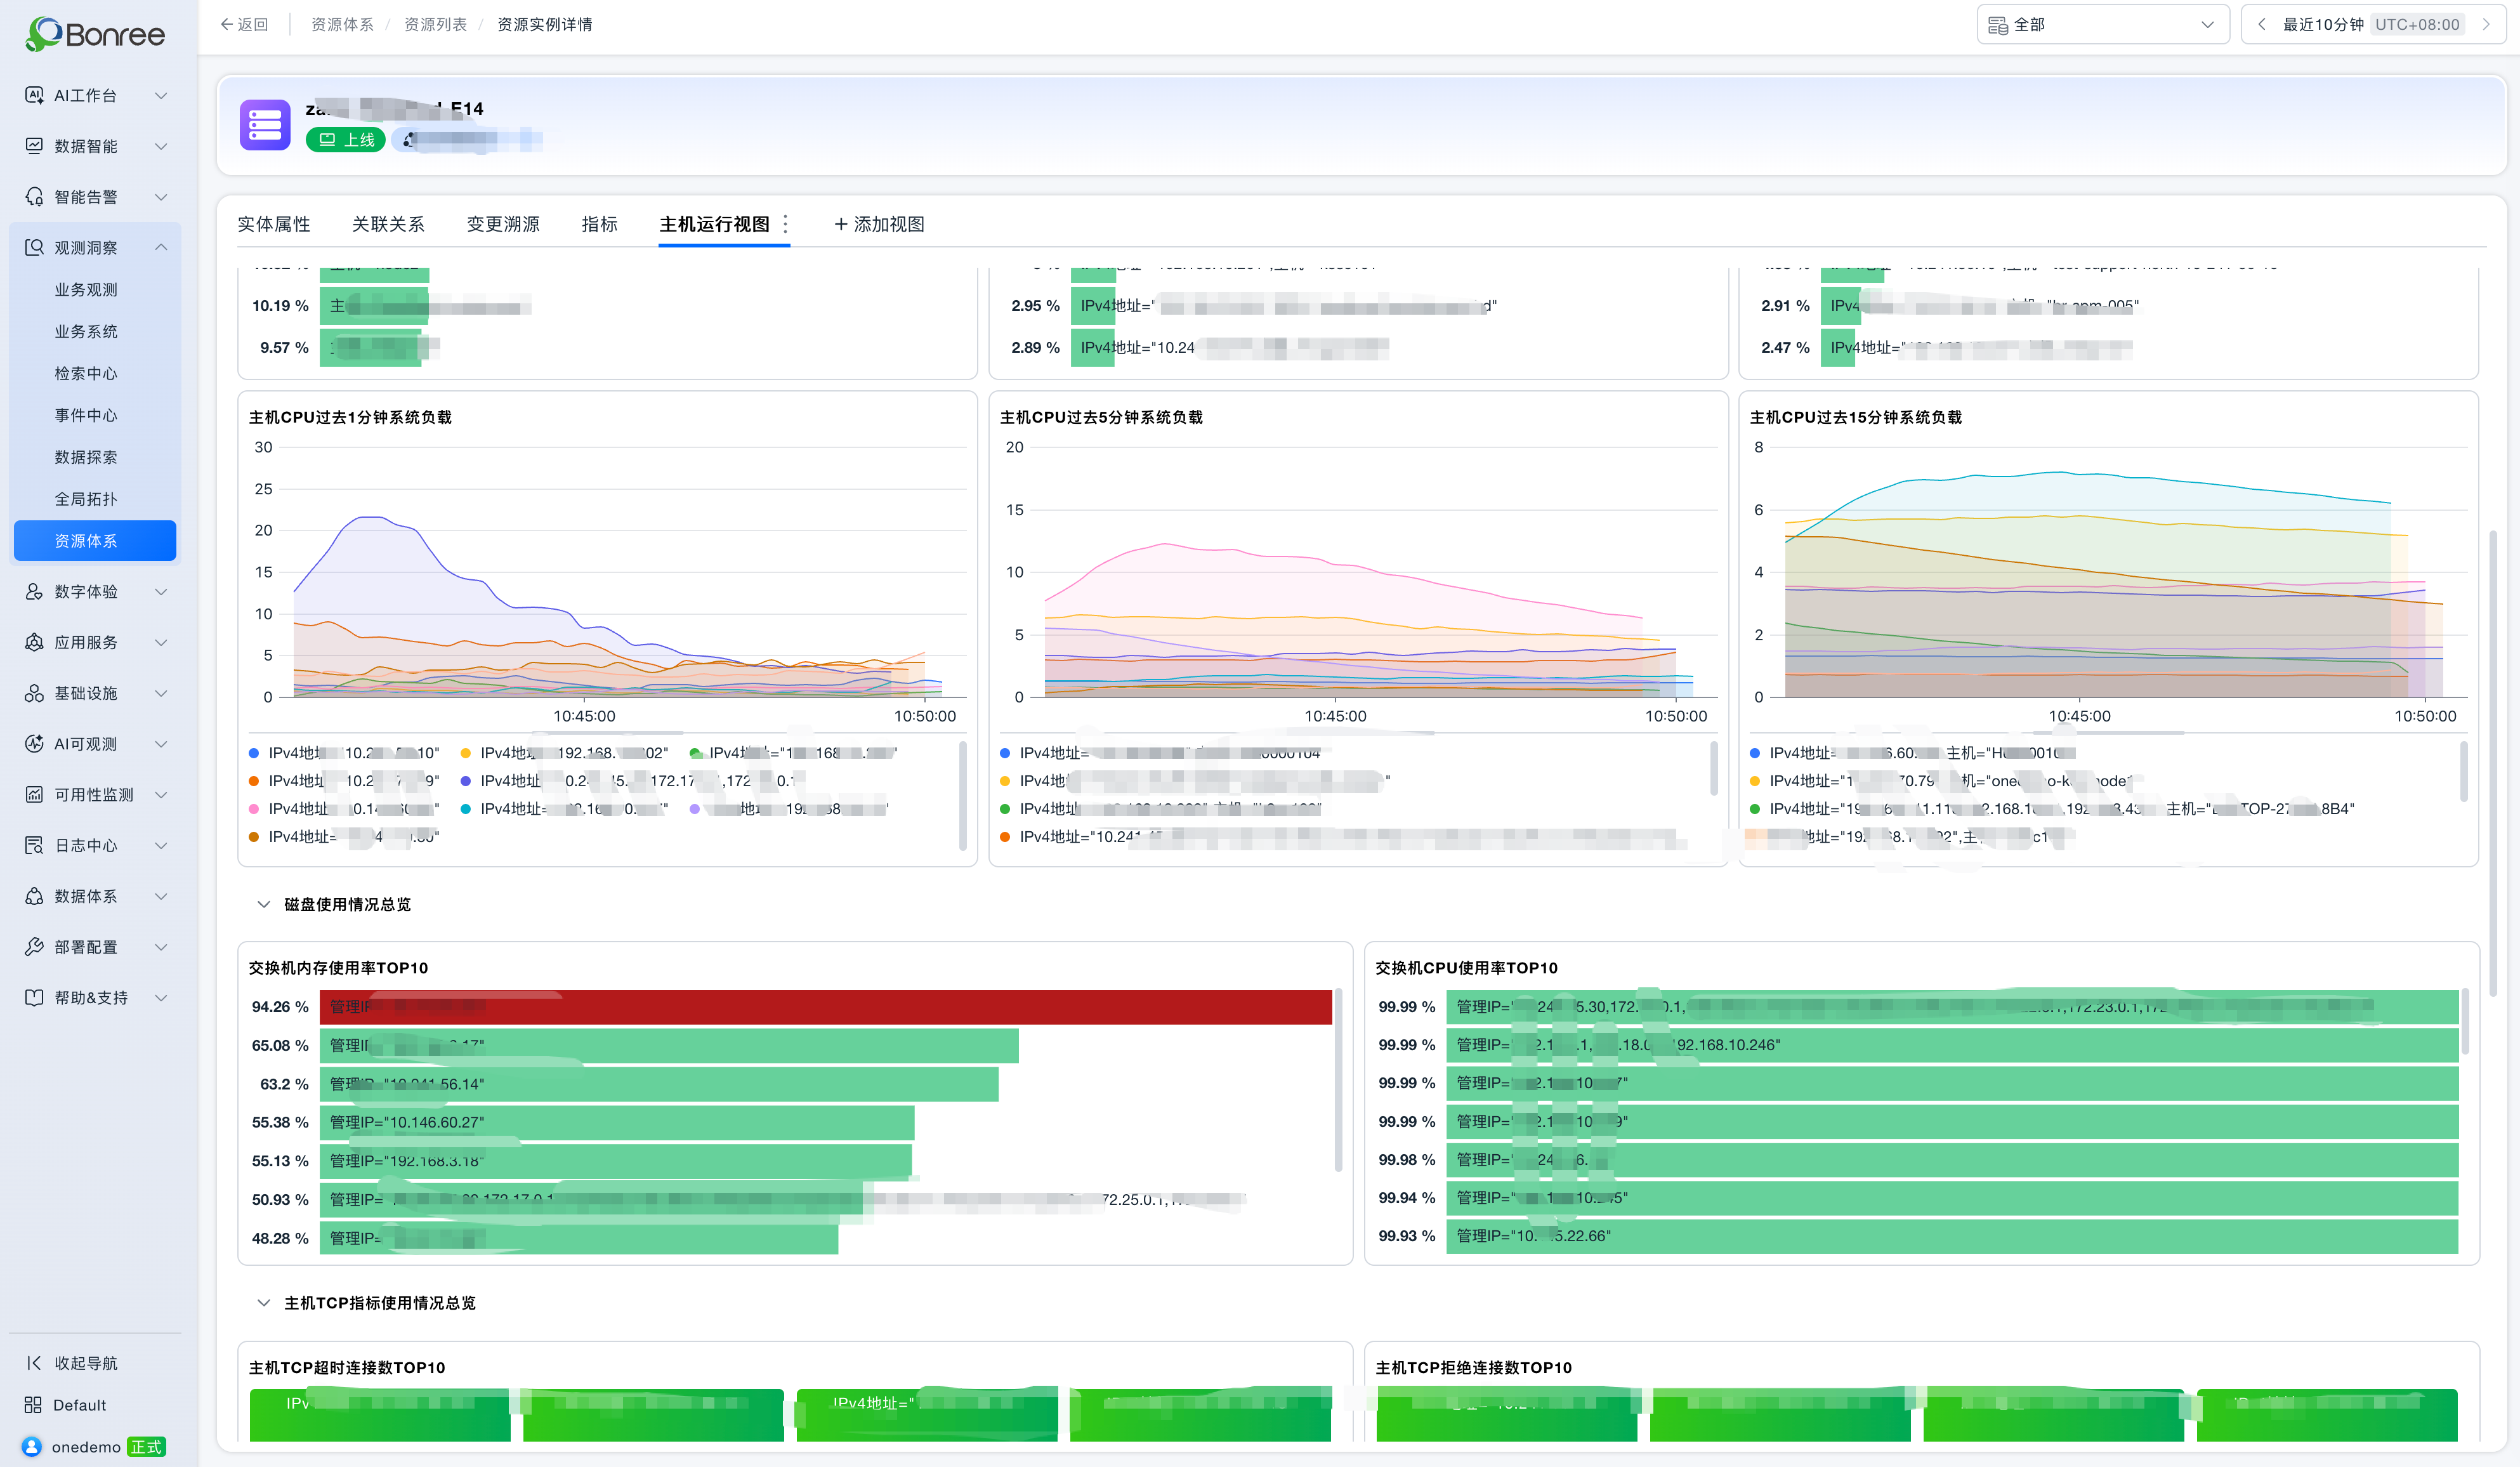
[Instance relationship topology]
RUM (Real User Monitoring)
Scheduling timeline for Android ANR. You can view how messages were scheduled on the UI thread before the app became unresponsive, filter for long-running messages, and compare them against jank records from the preceding minute. Collection must be enabled in the data collection rules of the mobile application before use.
1-second, 2-second, and 5-second open rates. These apply to app launch as well as H5 pages, single pages, native views, and mini-program views, so you can see how opens perform under different time thresholds.
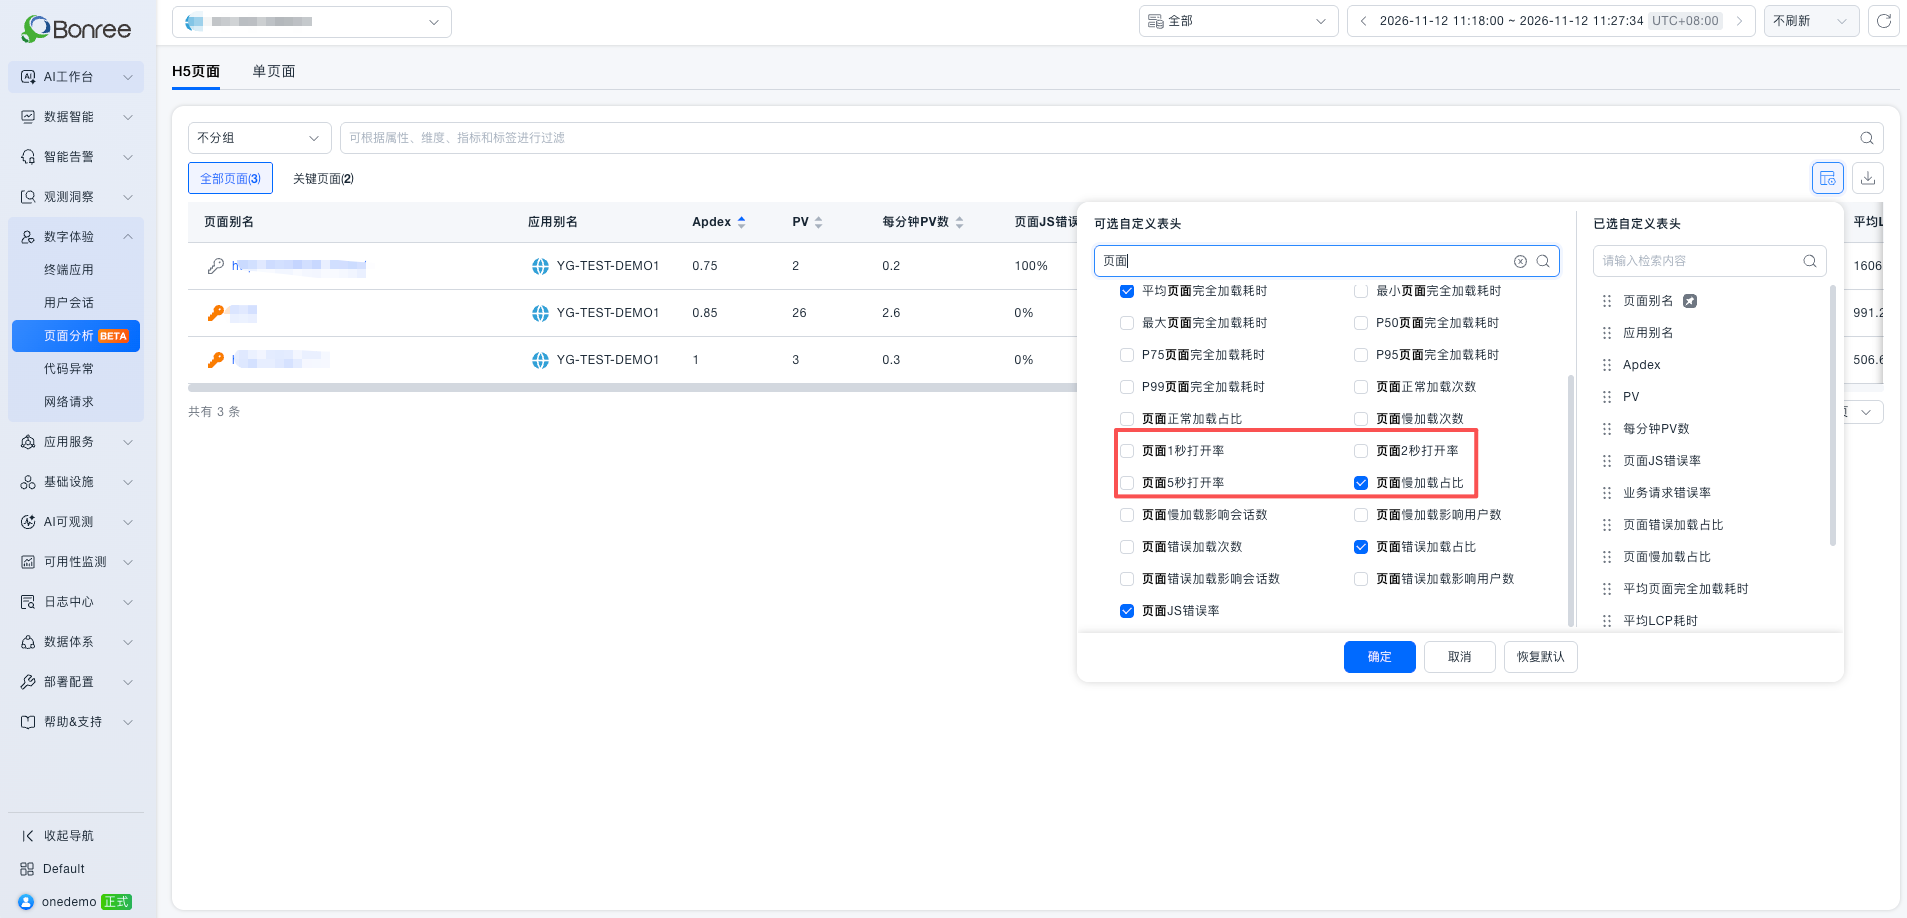
[Page open rates at 1, 2, and 5 seconds]
INP and CLS metrics. Single-page and H5 views on some platforms now include INP (Interaction to Next Paint) duration and CLS (Cumulative Layout Shift), for analyzing interaction responsiveness and page layout stability.
Sharing of sessions and network request details. You can generate a share link that lets recipients see the same details under the same time range and filters, which makes collaborative troubleshooting easier.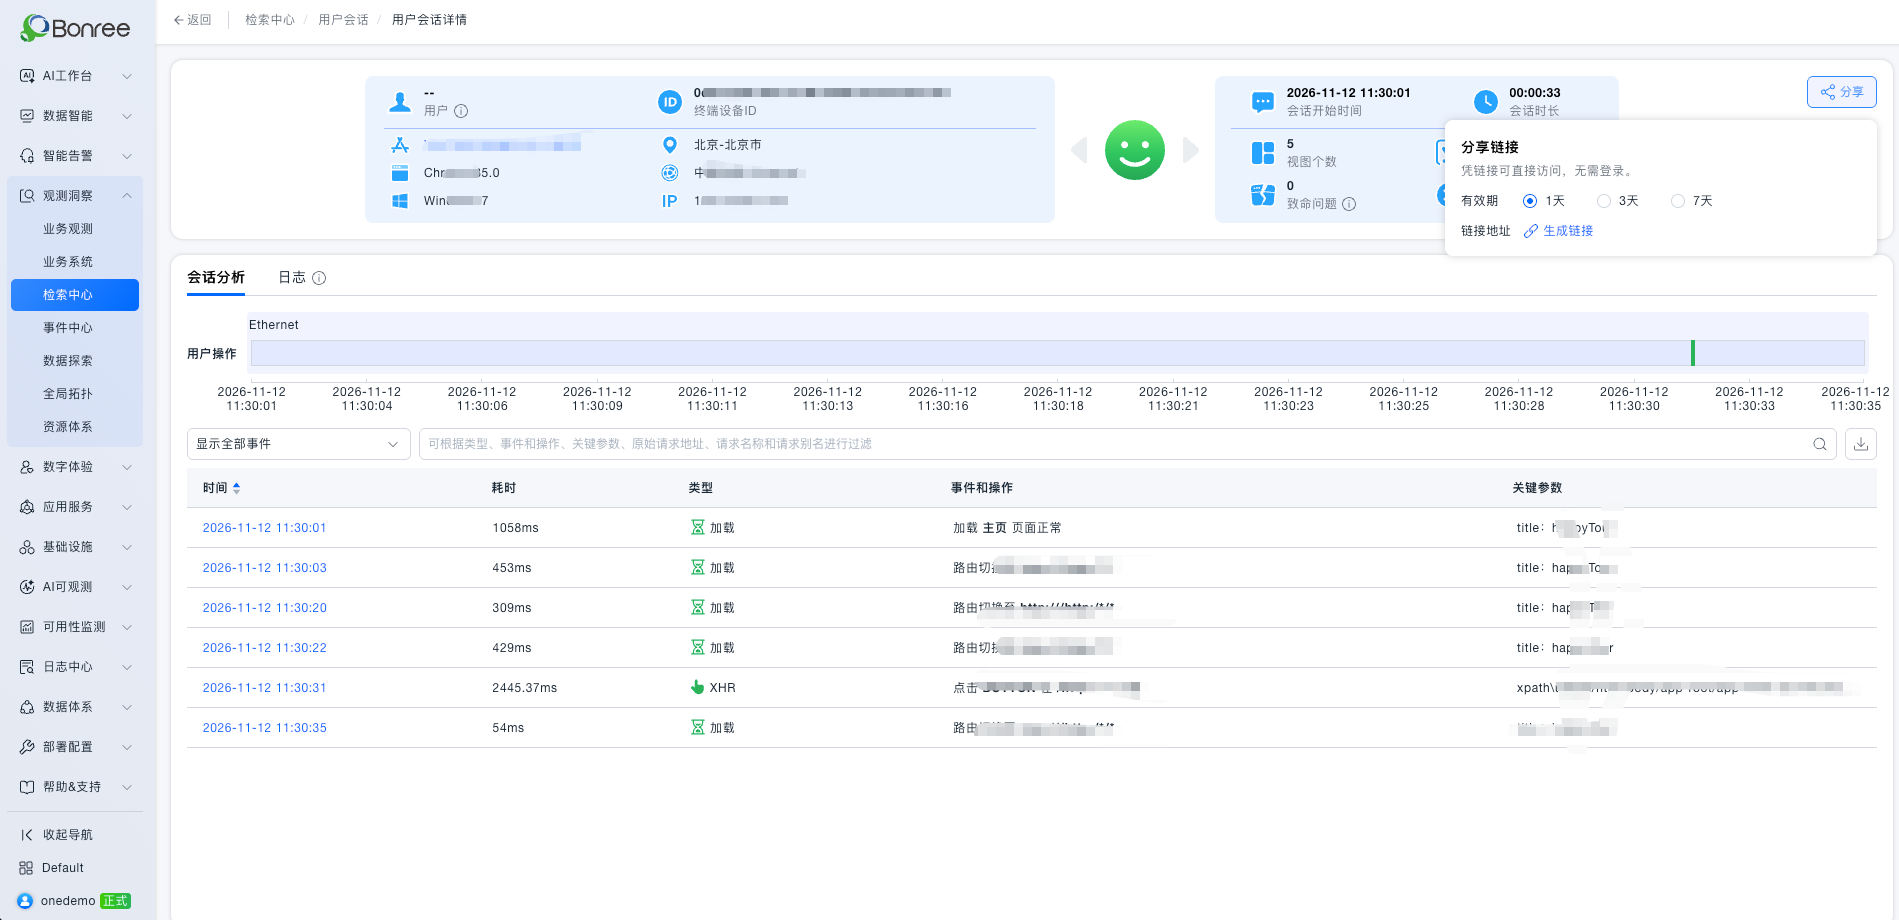
[Sharing user session details]
SmartAlert
Log alert integration. For logs ingested without an agent, you can extract the metrics you need through ETL and then configure alerts in SmartAlert. External logs are brought into a unified monitoring workflow, closing the gap between data ingestion and alert configuration.
Entity lookup from event alerts. From an event alert, you can look up the related entities and quickly find the objects that need checking. Event queries also support filtering and grouping by entity attributes. You can go from an alert straight to the related objects, instead of searching manually by name or tag.
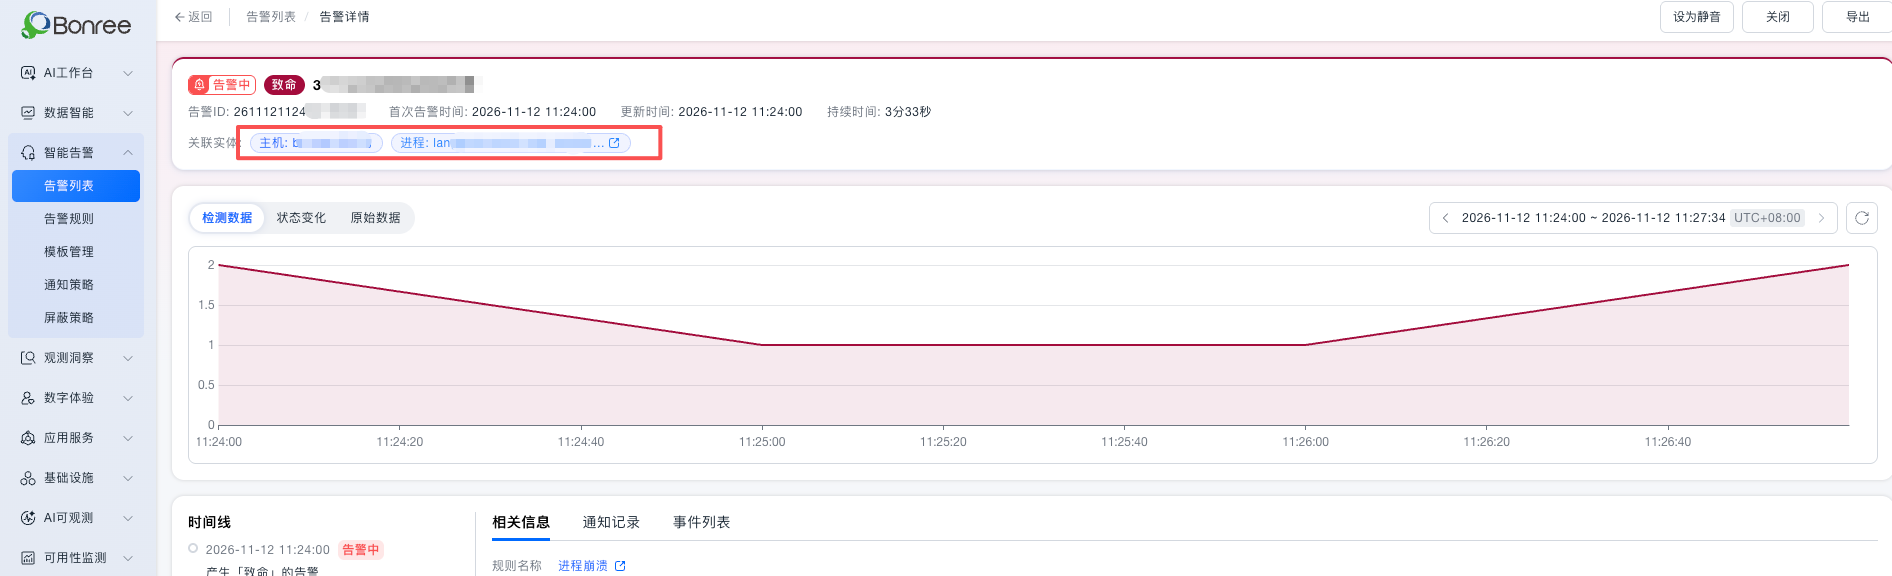
[Looking up related entities from an event alert]
Improved change detection. You can set the direction of change by absolute difference or percentage, and choose upward, downward, or bidirectional detection. This makes it easier to spot deviations from recent levels, whether you care about rises, drops, or swings in both directions.
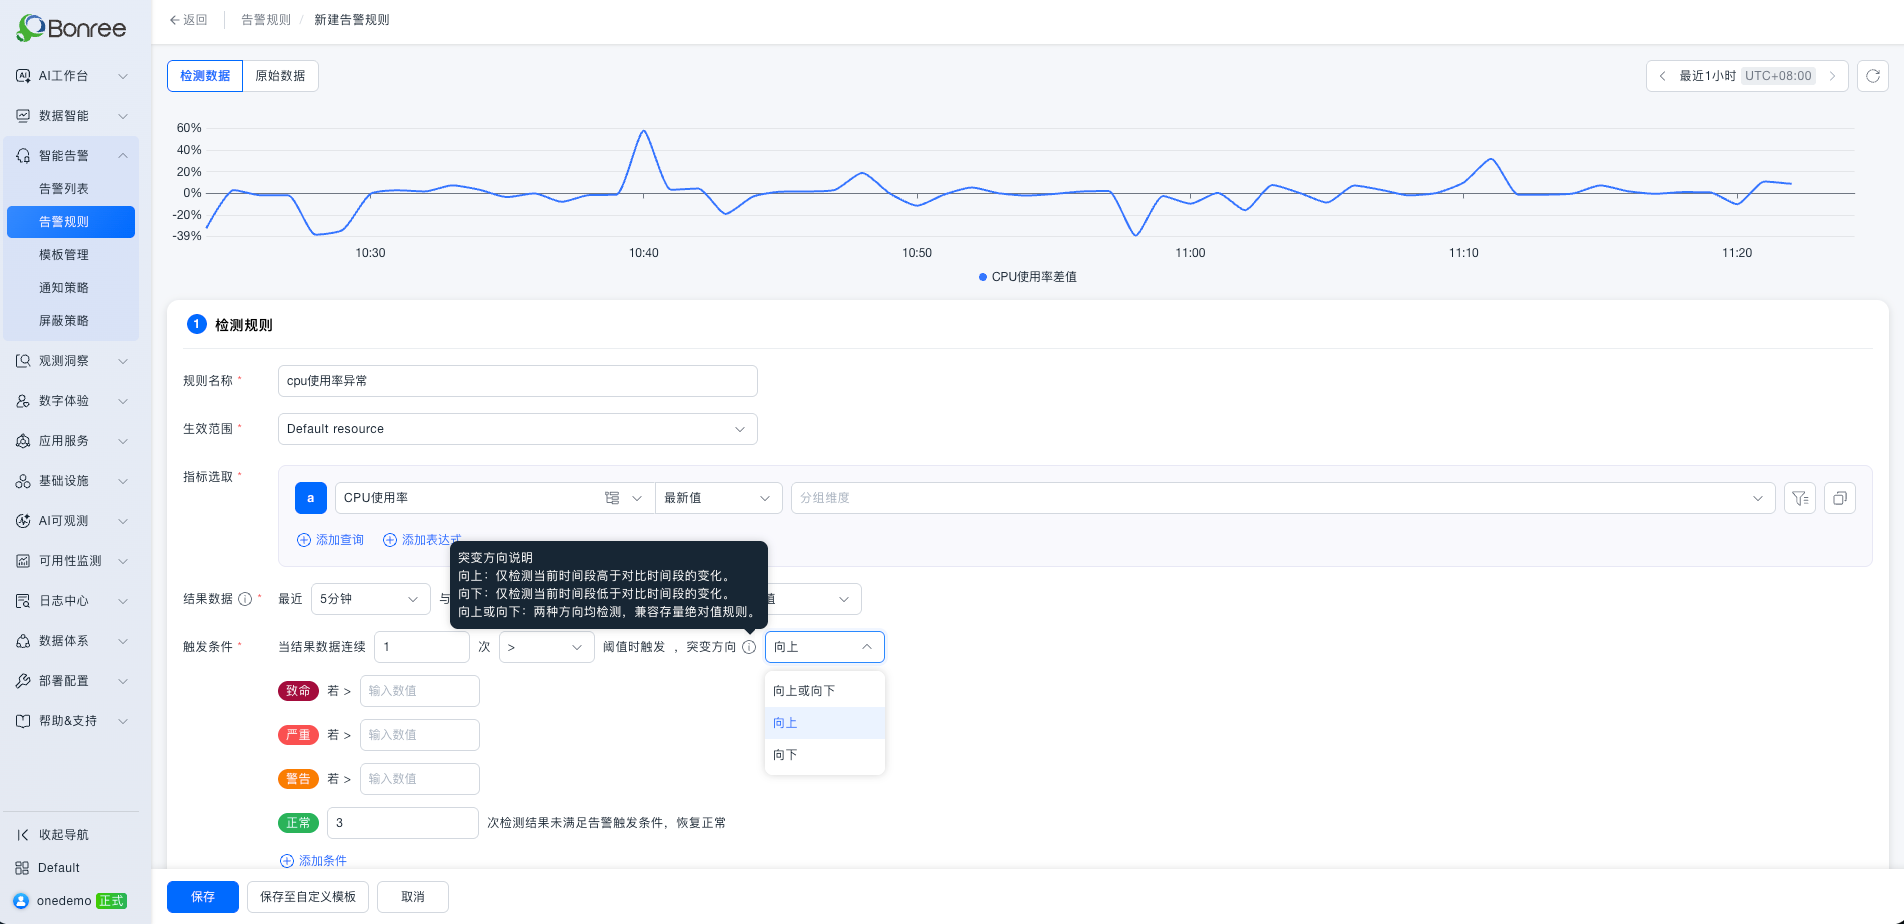
[Configuring change detection direction]
Notification policy details OpenAPI. Notification policy details can now be queried through OpenAPI, so external systems can read notification settings and integrations require less manual verification.
Analysis
Alert analysis by system and application. Analysis now supports the “System” and “Application” attributes of the alert model, and alert fields have been added to dashboards. Viewing alert distribution by business ownership helps teams focus on the systems and applications they are responsible for.
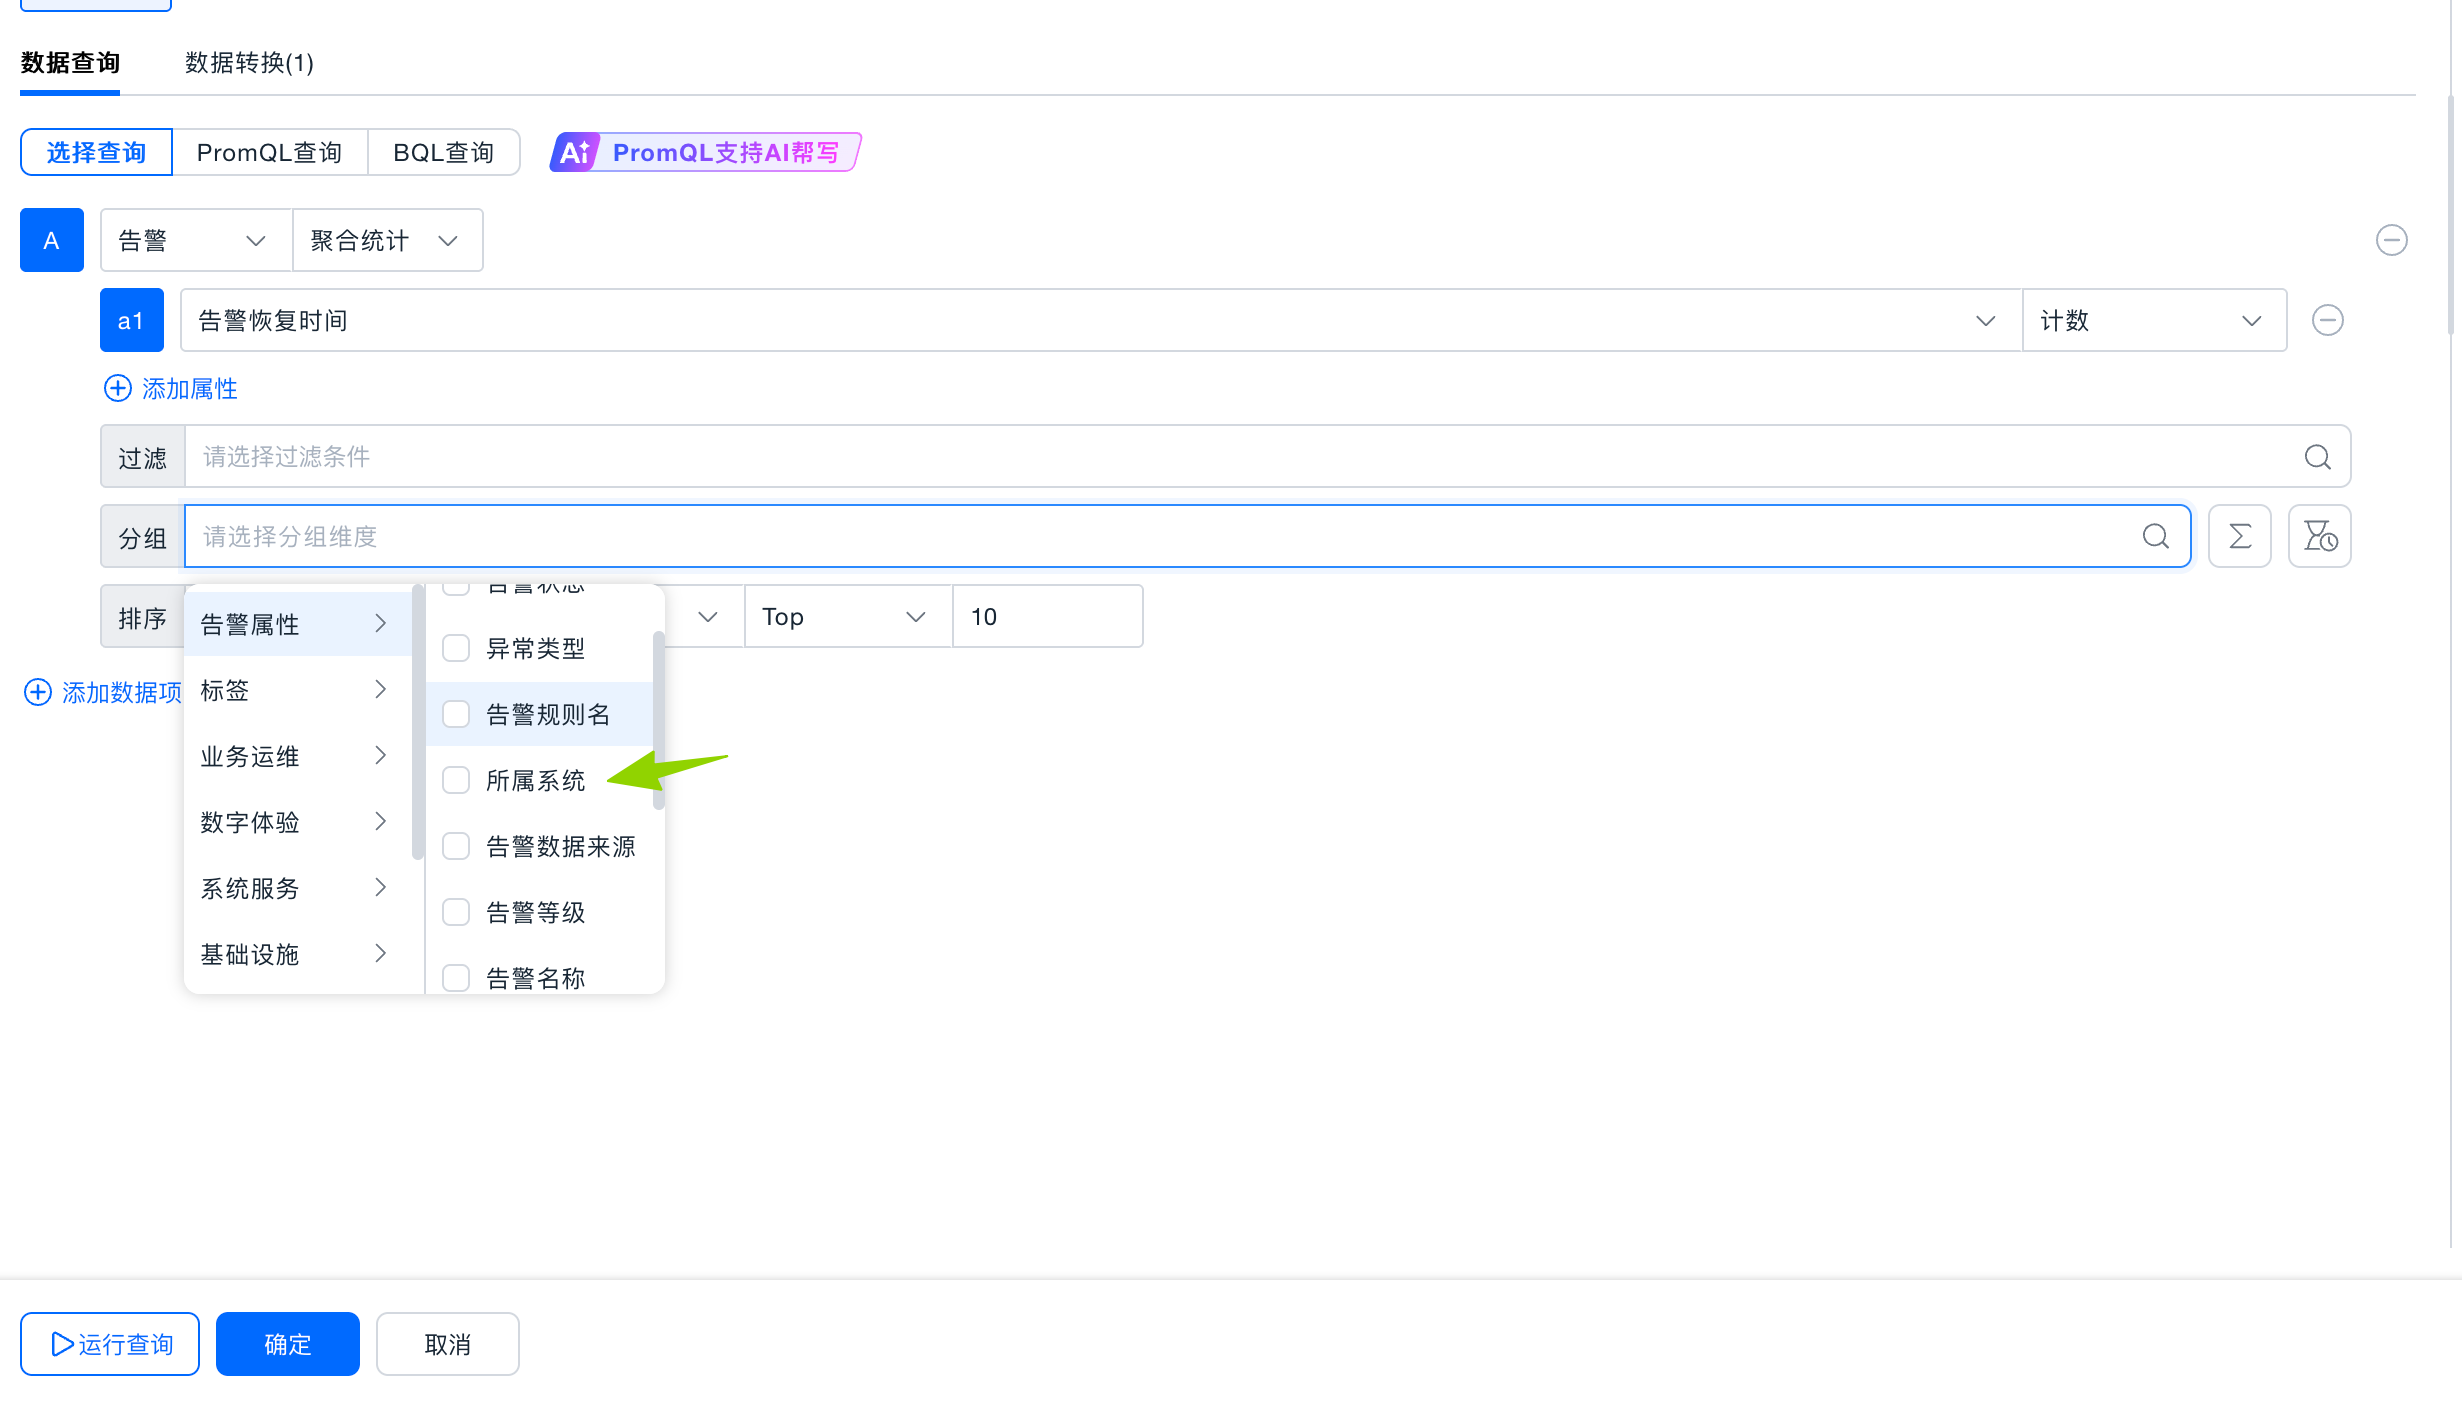
[Alert analysis by system and application]
Improved number widgets. The maximum query data volume has been adjusted, and Top 30 is now available, making rankings easier to view in dashboards. Comparing more ranked items in a single view helps you identify what to prioritize.
ETL Data Integration
Custom integrations. You can search for integration options for cloud products and external systems by name or category, configure data tasks through a guided workflow, and install metric, dashboard, or alert templates as needed. Ready-made integrations and matching templates reduce the configuration work from collection to dashboard.
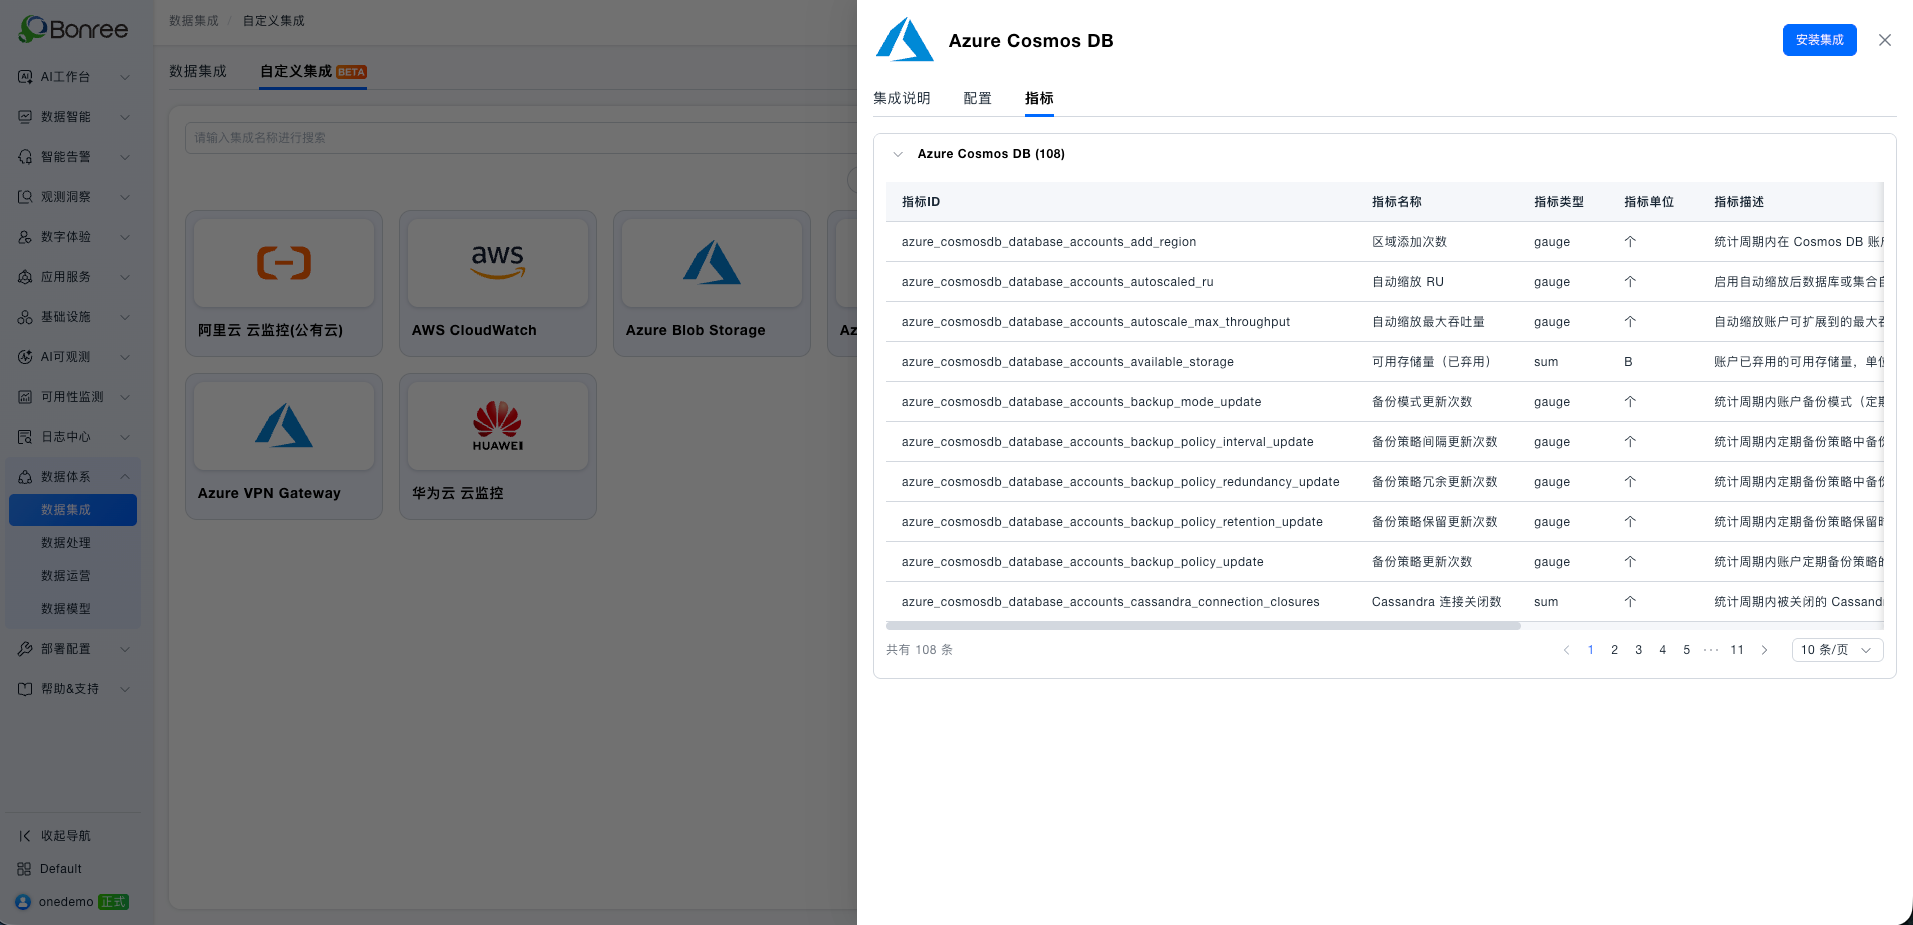
[Custom integration metric details]
Expanded AWS and Azure support. This release adds custom integration for AWS and cloud monitoring for Azure. Observability data from different cloud environments can be viewed in one place, with less switching between cloud consoles.
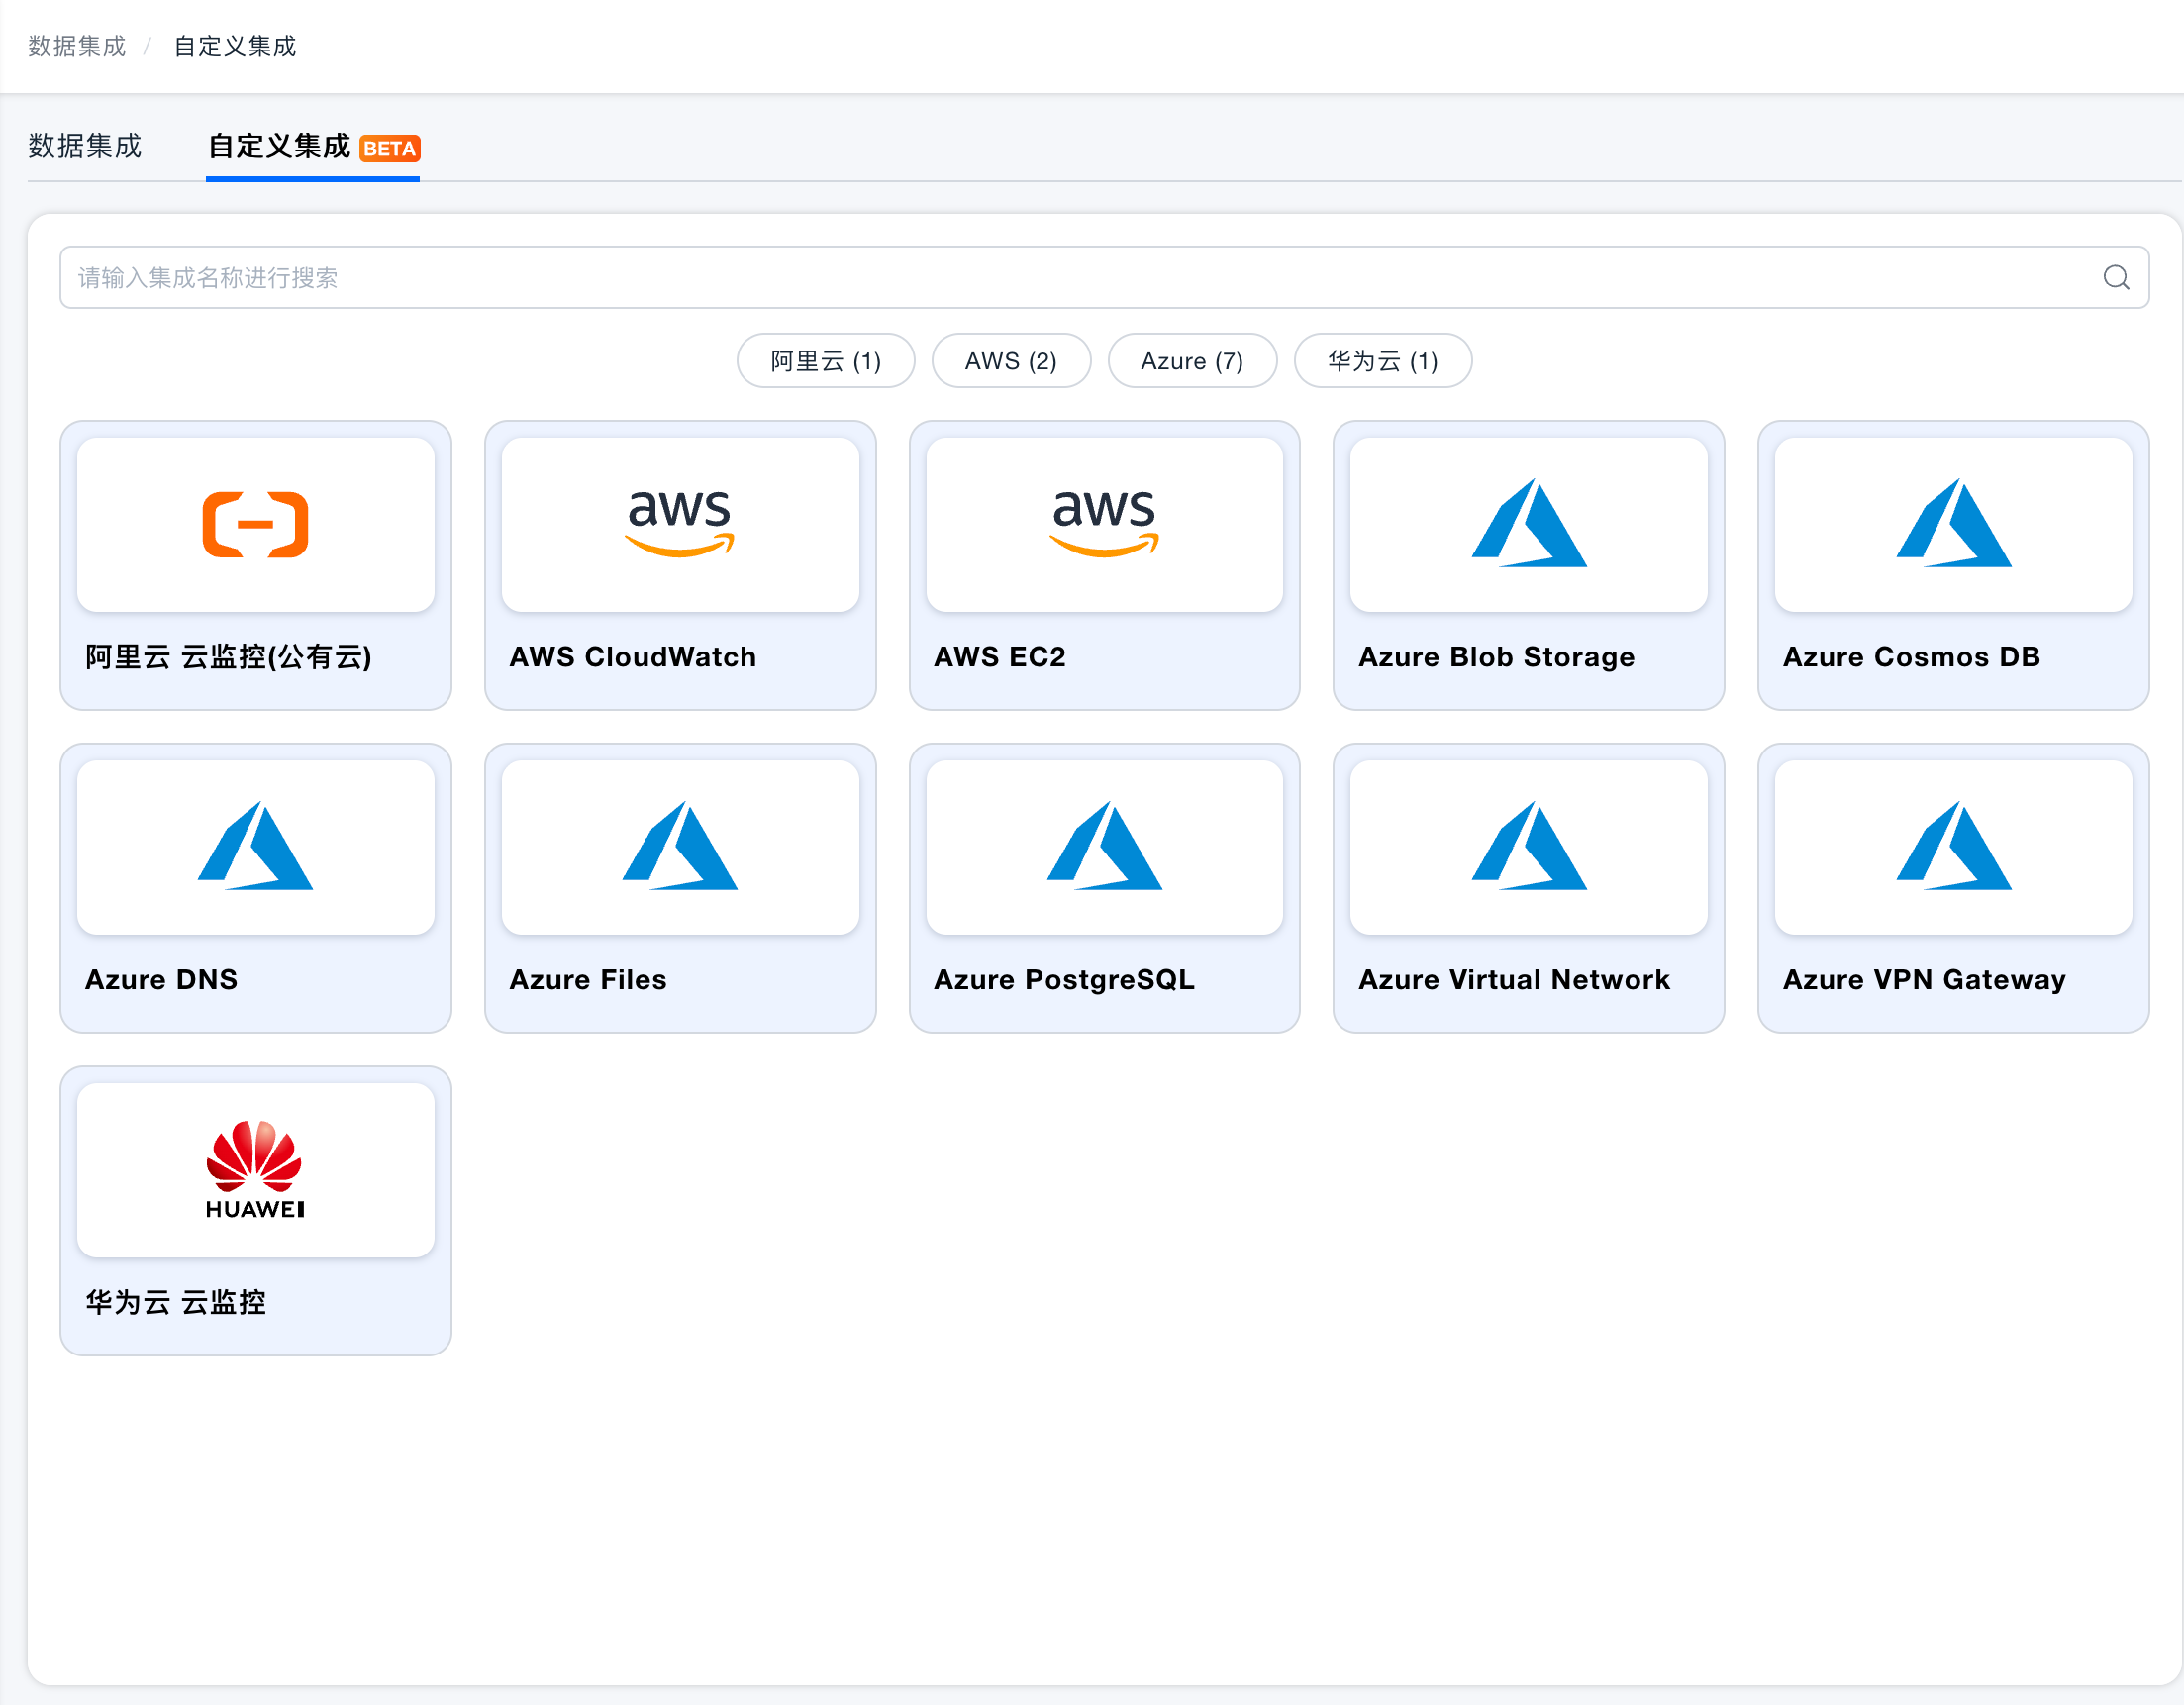
[Custom integration configuration page]
Other Updates
STM synthetic monitoring: Monitoring point status checks now support SSL tasks, and saturation thresholds can be configured by task type. SmartGate can send data through a proxy.
IAM accounts and permissions: A PassToken is now generated automatically when you add a primary account or IAM user.
TitanQuery query engine: Event queries support grouping by entity attributes, and database connection pool information can now be provided for collection by Tianyan.
For the full list of changes and upgrade notes, see the Bonree ONE 4.0.3.0 release notes.